Sample-size and power reportsรายงานการคำนวณขนาดตัวอย่างและอำนาจการทดสอบ
Sample-size and power reportsรายงานการคำนวณขนาดตัวอย่างและอำนาจการทดสอบ
Three invented study teams asked for a sample size before writing their protocols. A workplace health team plans to compare a guided walking-and-stretching programme with usual care for office staff, with systolic blood pressure and meeting a weekly activity target as endpoints. A community screening team wants to measure how accurate a fingertip haemoglobin meter is for anaemia against the laboratory blood count. A primary-care clinic wants to build a model that predicts which adults will miss their next scheduled appointment. Every team, input and number on this page is invented for the sample: the planning inputs are invented, no study data were collected or simulated, and no real study, person or client project is involved.ทีมวิจัยสมมุติสามทีมขอให้คำนวณขนาดตัวอย่างก่อนเขียนโครงร่างการวิจัย ทีมสุขภาพในที่ทำงานวางแผนเปรียบเทียบโปรแกรมเดินและยืดเหยียดร่างกายที่มีผู้นำกิจกรรม กับการดูแลตามปกติในพนักงานสำนักงาน โดยมีผลลัพธ์คือความดันโลหิตซิสโตลิกและการทำกิจกรรมทางกายได้ตามเป้าหมายรายสัปดาห์ ทีมคัดกรองในชุมชนต้องการประเมินความถูกต้องของเครื่องวัดฮีโมโกลบินจากปลายนิ้วในการคัดกรองภาวะโลหิตจาง เทียบกับผลตรวจความสมบูรณ์ของเม็ดเลือดทางห้องปฏิบัติการ และคลินิกปฐมภูมิแห่งหนึ่งต้องการสร้างตัวแบบพยากรณ์ว่าผู้ใหญ่รายใดจะไม่มาตามนัดครั้งถัดไป ทีม ค่าที่กำหนด และตัวเลขทั้งหมดในหน้านี้สมมุติขึ้นสำหรับตัวอย่างนี้ ค่าที่ใช้วางแผนเป็นค่าสมมุติ ไม่มีการเก็บหรือจำลองข้อมูลการศึกษา และไม่เกี่ยวข้องกับการศึกษา บุคคล หรืองานของลูกค้ารายใด
What you receiveสิ่งที่คุณจะได้รับ
A sample-size calculation for your design, with each assumption and its source, the method used, and how the number changes when the assumptions change.คำนวณขนาดตัวอย่างตามรูปแบบการศึกษาของคุณ ระบุสมมติฐานแต่ละข้อพร้อมที่มา วิธีที่ใช้คำนวณ และแสดงว่าจำนวนที่ได้เปลี่ยนไปอย่างไรเมื่อสมมติฐานเปลี่ยน
- The calculation for a comparison of groups, a diagnostic study or a prediction model, whichever your design is.การคำนวณสำหรับการเปรียบเทียบระหว่างกลุ่ม การศึกษาความแม่นยำของการวินิจฉัย หรือแบบจำลองพยากรณ์ ตามรูปแบบการศึกษาของคุณ
- Every assumption listed with where its value came from.สมมติฐานทุกข้อ พร้อมที่มาของค่าที่ใช้
- A sensitivity table or curve across plausible assumptions.ตารางหรือกราฟแสดงว่าผลการคำนวณไวต่อสมมติฐานในช่วงที่เป็นไปได้มากน้อยเพียงใด
- The allowance for drop-out or missing data, shown separately.จำนวนที่เผื่อไว้สำหรับผู้ถอนตัวหรือข้อมูลขาดหาย แยกแสดงให้เห็นชัด
The sampleตัวอย่างงาน
Sample work on simulated data. No real patient, no client project.ตัวอย่างงานจากข้อมูลจำลองทั้งหมด ไม่ใช่ข้อมูลผู้ป่วยจริง และไม่ใช่งานของลูกค้ารายใด
A sample-size job has no data set. For each design the buyer receives a short report: the assumptions written as the buyer's own inputs, the method, the result, a table to read it from, and a sensitivity table or figure that shows how the answer moves when an assumption changes. Every number below is computed by code from the stated inputs.งานคำนวณขนาดตัวอย่างไม่มีชุดข้อมูล สิ่งที่ผู้ว่าจ้างได้รับสำหรับแต่ละรูปแบบการศึกษาคือรายงานสั้น ๆ ประกอบด้วย สมมติฐานซึ่งเขียนเป็นค่าที่ผู้ว่าจ้างกำหนดเอง วิธีคำนวณ ผลการคำนวณ ตารางสำหรับอ่านผล และตารางหรือรูปการวิเคราะห์ความอ่อนไหว (sensitivity analysis) ที่แสดงว่าคำตอบเปลี่ยนไปอย่างไรเมื่อสมมติฐานเปลี่ยน ตัวเลขทุกตัวด้านล่างคำนวณด้วยโค้ดจากค่าที่กำหนดไว้
The answer is only as good as the assumptions. The expected effect, standard deviation, accuracy, prevalence and C-statistic are the buyer's to justify from published literature or pilot data; the calculation does not check them.คำตอบจะน่าเชื่อถือเพียงใดขึ้นอยู่กับสมมติฐานทั้งหมด ขนาดผลที่คาดไว้ ส่วนเบี่ยงเบนมาตรฐาน ความถูกต้องของการตรวจ ความชุก และ C-statistic เป็นค่าที่ผู้ว่าจ้างต้องให้เหตุผลรองรับจากงานวิจัยที่ตีพิมพ์แล้วหรือข้อมูลจากการศึกษานำร่อง การคำนวณไม่ได้ตรวจสอบความถูกต้องของค่าเหล่านี้
Two-group comparisonการเปรียบเทียบระหว่างสองกลุ่ม
Assumptions. The workplace team expects the programme to lower mean systolic blood pressure by 5.0 mmHg compared with usual care, with a standard deviation of 12.0 mmHg in both groups. For the binary endpoint they expect 30% of staff to meet the weekly activity target with usual care and 45% with the programme. They want a two-sided alpha of 0.05 and a power of 80%, and expect 15% of participants to have no endpoint.สมมติฐาน ทีมสุขภาพในที่ทำงานคาดว่าโปรแกรมจะลดค่าเฉลี่ยความดันโลหิตซิสโตลิกได้ 5.0 mmHg เมื่อเทียบกับการดูแลตามปกติ โดยมีส่วนเบี่ยงเบนมาตรฐาน 12.0 mmHg เท่ากันทั้งสองกลุ่ม สำหรับผลลัพธ์แบบทวิภาค คาดว่าพนักงานที่ได้รับการดูแลตามปกติจะทำกิจกรรมทางกายได้ตามเป้าหมายรายสัปดาห์ 30% และในกลุ่มโปรแกรม 45% กำหนดระดับนัยสำคัญแบบสองทาง (two-sided alpha) ไว้ที่ 0.05 อำนาจการทดสอบ 80% และคาดว่าผู้เข้าร่วม 15% จะออกจากการศึกษาโดยไม่มีข้อมูลผลลัพธ์
Method. Both calculations assume equal allocation to the two groups. The continuous endpoint uses the power calculation for a two-sample t-test with a common standard deviation, based on the non-central t distribution. The binary endpoint uses the calculation for comparing two proportions with the normal approximation, which assumes analysis by the chi-square test without continuity correction; a continuity-corrected or exact test needs somewhat more, 176 per group with a continuity correction. Each per-group size is rounded up and its power is checked again at the rounded size; it is then divided by one minus the dropout proportion and rounded up again to give the number to recruit.วิธีคำนวณ การคำนวณทั้งสองแบบสมมุติว่าจัดสรรผู้เข้าร่วมเข้าสองกลุ่มในจำนวนเท่ากัน ผลลัพธ์แบบต่อเนื่องใช้การคำนวณอำนาจการทดสอบของการทดสอบทีสำหรับสองกลุ่มอิสระ (two-sample t-test) ที่สมมุติว่าส่วนเบี่ยงเบนมาตรฐานเท่ากันทั้งสองกลุ่ม ซึ่งอาศัยการแจกแจงทีแบบไม่เป็นศูนย์กลาง (non-central t distribution) ส่วนผลลัพธ์แบบทวิภาคใช้การคำนวณสำหรับเปรียบเทียบสองสัดส่วนด้วยการประมาณจากการแจกแจงปกติ ซึ่งสมมุติว่าจะวิเคราะห์ด้วยการทดสอบไคสแควร์ (chi-square test) โดยไม่ใช้การปรับแก้ความต่อเนื่อง (continuity correction) หากใช้การปรับแก้ความต่อเนื่องหรือการทดสอบแบบแม่นตรง (exact test) จะต้องใช้ขนาดตัวอย่างมากขึ้นเล็กน้อย คือ 176 คนต่อกลุ่มเมื่อใช้การปรับแก้ความต่อเนื่อง ขนาดตัวอย่างต่อกลุ่มปัดขึ้นเป็นจำนวนเต็มและตรวจอำนาจการทดสอบซ้ำที่ขนาดที่ปัดแล้ว จากนั้นหารด้วยหนึ่งลบสัดส่วนผู้ออกจากการศึกษาและปัดขึ้นอีกครั้ง จึงได้จำนวนที่ต้องรับเข้าการศึกษา
Result. The continuous endpoint needs 92 participants per group (184 analysed), or 218 to recruit after allowing for dropout. The binary endpoint needs the larger sample: 163 per group (326 analysed), or 384 to recruit. If both endpoints are primary, the study needs the larger number, 384, and the alpha may need adjusting for two tests, which would raise both sizes.ผลการคำนวณ ผลลัพธ์แบบต่อเนื่องต้องใช้ผู้เข้าร่วม 92 คนต่อกลุ่ม (วิเคราะห์รวม 184 คน) หรือต้องรับเข้า 218 คนเมื่อเผื่อผู้ออกจากการศึกษาแล้ว ส่วนผลลัพธ์แบบทวิภาคต้องใช้ขนาดตัวอย่างมากกว่า คือ 163 คนต่อกลุ่ม (วิเคราะห์รวม 326 คน) หรือต้องรับเข้า 384 คน หากผลลัพธ์ทั้งสองเป็นผลลัพธ์หลัก การศึกษาต้องใช้จำนวนที่มากกว่าคือ 384 คน และอาจต้องปรับระดับนัยสำคัญสำหรับการทดสอบสองครั้ง ซึ่งจะทำให้ขนาดตัวอย่างของทั้งสองผลลัพธ์เพิ่มขึ้นอีก
| Item | Endpoint type | |
|---|---|---|
| Continuous endpoint | Binary endpoint | |
| Inputs (the buyer's assumptions) | ||
| Endpoint | Systolic blood pressure | Weekly activity target met |
| Effect to detect | 5.0 mmHg difference in means | 30% vs 45% |
| Standard deviation | 12.0 mmHg | Not needed |
| Two-sided alpha | 0.05 | 0.05 |
| Power | 80% | 80% |
| Expected dropout | 15% | 15% |
| Method | ||
| Test and design assumed | Two-sample t-test, equal SDs, equal allocation | Two proportions, normal approximation, no continuity correction, equal allocation |
| Result | ||
| Per group, unrounded | 91.39 | 162.33 |
| Per group, rounded up | 92 | 163 |
| Power at the rounded-up size | 80.3% | 80.2% |
| Total analysed | 184 | 326 |
| Per group to recruit* | 109 | 192 |
| Total to recruit | 218 | 384 |
- * Per group to recruit is the per-group size divided by one minus the expected dropout proportion, rounded up.* จำนวนที่ต้องรับเข้าต่อกลุ่ม คือขนาดตัวอย่างต่อกลุ่มหารด้วยหนึ่งลบสัดส่วนผู้ออกจากการศึกษาที่คาดไว้ แล้วปัดขึ้น
How to read the table. The first rows repeat the buyer's inputs and the method, so the report can be checked against the protocol. In the result rows, the unrounded size is what the formula gives, the rounded-up size reaches the planned power (80.3% and 80.2% at the rounded sizes), and the bold row is the number to recruit.วิธีอ่านตาราง แถวแรก ๆ แสดงค่าที่ผู้ว่าจ้างกำหนดและวิธีคำนวณซ้ำอีกครั้ง เพื่อให้ตรวจเทียบกับโครงร่างการวิจัยได้ ในแถวผลการคำนวณ ขนาดก่อนปัดเศษคือค่าที่ได้จากสูตร ขนาดที่ปัดขึ้นแล้วให้อำนาจการทดสอบถึงระดับที่วางแผนไว้ (80.3% และ 80.2% ที่ขนาดที่ปัดแล้ว) และแถวตัวหนาคือจำนวนที่ต้องรับเข้าการศึกษา
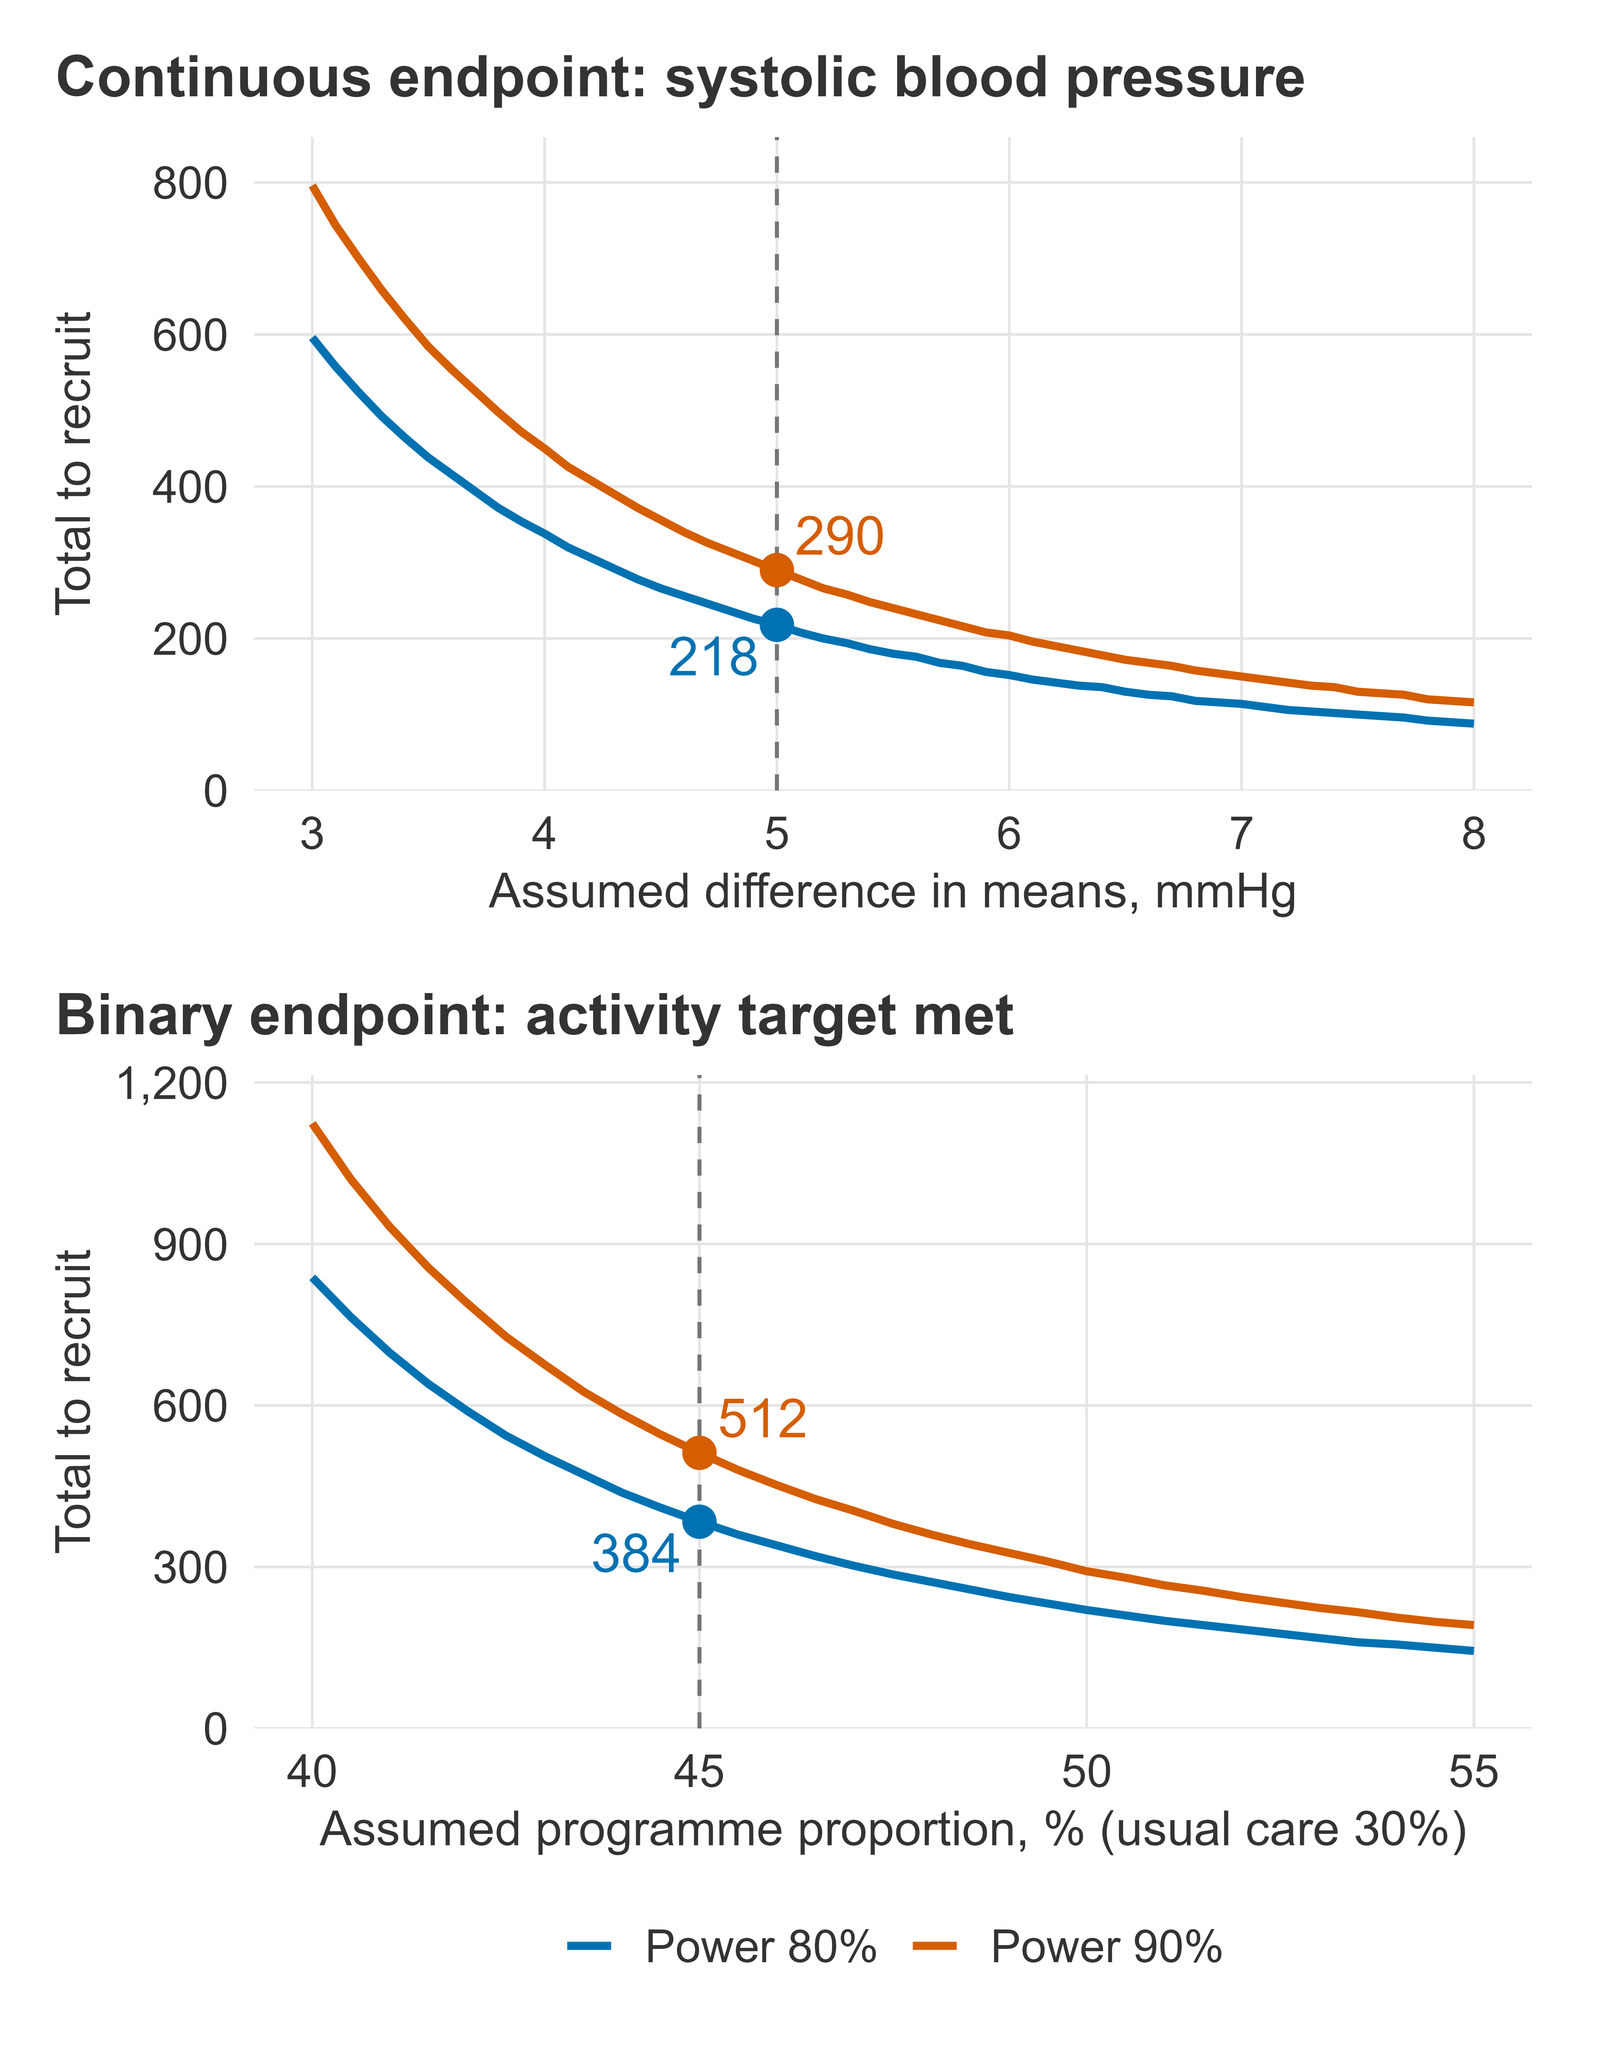
How to read the figure. Each line shows how many people must be recruited if the true effect is smaller or larger than assumed. The curves rise steeply to the left: if the true difference in means were 3.0 mmHg instead of 5.0 mmHg, the study would need 596 participants, 2.7 times as many. Raising the power to 90% at the assumed effects needs 290 for the continuous endpoint and 512 for the binary endpoint.วิธีอ่านรูป แต่ละเส้นแสดงจำนวนคนที่ต้องรับเข้าการศึกษา หากขนาดผลจริงเล็กหรือใหญ่กว่าที่สมมุติไว้ เส้นโค้งชันขึ้นมากทางด้านซ้าย หากผลต่างของค่าเฉลี่ยที่แท้จริงเป็น 3.0 mmHg แทนที่จะเป็น 5.0 mmHg การศึกษาจะต้องใช้ผู้เข้าร่วม 596 คน คิดเป็น 2.7 เท่าของจำนวนเดิม หากเพิ่มอำนาจการทดสอบเป็น 90% ที่ขนาดผลตามที่สมมุติ ผลลัพธ์แบบต่อเนื่องจะต้องรับเข้า 290 คน และผลลัพธ์แบบทวิภาค 512 คน
Diagnostic accuracy studyการศึกษาความถูกต้องของการตรวจวินิจฉัย
Assumptions. The screening team expects the fingertip meter to have a sensitivity of 90% and a specificity of 85% against the laboratory blood count, and expects 20% of the people screened to have anaemia. They want each estimate to have a 95% confidence interval no wider than plus or minus 5.0 percentage points.สมมติฐาน ทีมคัดกรองคาดว่าเครื่องวัดจากปลายนิ้วจะมีความไว (sensitivity) 90% และความจำเพาะ (specificity) 85% เมื่อเทียบกับผลตรวจความสมบูรณ์ของเม็ดเลือดทางห้องปฏิบัติการ และคาดว่าผู้ที่มารับการคัดกรอง 20% มีภาวะโลหิตจาง ทีมต้องการให้ค่าประมาณแต่ละค่ามีช่วงความเชื่อมั่น 95% กว้างไม่เกินบวกลบ 5.0 จุดร้อยละ
Method (Buderer's approach). The number of people with anaemia needed is z squared times the sensitivity times one minus the sensitivity, divided by the half-width squared, with z = 1.960; dividing it by the prevalence gives the total to screen for sensitivity. The number without anaemia is found the same way from the specificity and divided by one minus the prevalence. The study needs the larger of the two totals. The result is then checked with the exact Clopper-Pearson interval at the expected counts.วิธีคำนวณ (วิธีของ Buderer) จำนวนผู้มีภาวะโลหิตจางที่ต้องการเท่ากับ z ยกกำลังสอง คูณความไว คูณหนึ่งลบความไว แล้วหารด้วยครึ่งความกว้างยกกำลังสอง โดย z = 1.960 เมื่อหารด้วยความชุกจะได้จำนวนรวมที่ต้องคัดกรองสำหรับความไว จำนวนผู้ไม่มีภาวะโลหิตจางคำนวณแบบเดียวกันจากความจำเพาะ แล้วหารด้วยหนึ่งลบความชุก การศึกษาต้องใช้จำนวนรวมที่มากกว่าในสองค่านี้ จากนั้นตรวจสอบผลด้วยช่วงความเชื่อมั่นแบบแม่นตรงของ Clopper-Pearson (exact interval) ที่จำนวนที่คาดไว้
Result. Sensitivity needs 139 people with anaemia, so 695 people must be screened; specificity needs 196 people without anaemia, or 245 screened. The sensitivity requirement drives the answer: 695 people to screen.ผลการคำนวณ การประมาณความไวต้องใช้ผู้มีภาวะโลหิตจาง 139 คน จึงต้องคัดกรองทั้งหมด 695 คน ส่วนการประมาณความจำเพาะต้องใช้ผู้ไม่มีภาวะโลหิตจาง 196 คน หรือคัดกรอง 245 คน ดังนั้นจำนวนที่ต้องใช้เพื่อประมาณความไวเป็นตัวกำหนดคำตอบ คือต้องคัดกรอง 695 คน
| Item | Estimate | |
|---|---|---|
| Sensitivity | Specificity | |
| Inputs (the buyer's assumptions) | ||
| Expected value | 90% | 85% |
| Confidence level | 95% | 95% |
| Wanted half-width, percentage points | 5.0 | 5.0 |
| Share of people screened | 20% with anaemia | 80% without anaemia |
| Buderer's calculation | ||
| z | 1.960 | 1.960 |
| People needed in this group, unrounded | 138.3 | 195.9 |
| People needed in this group, rounded up | 139 | 196 |
| Total to screen for this estimate | 695 | 245 |
| Drives the total | Yes | No |
| Exact check at a total of 695 | ||
| Expected people in this group | 139 | 556 |
| Exact 95% CI (Clopper-Pearson) | 83.7% to 94.4% | 81.8% to 87.9% |
| Exact half-width, percentage points | 5.4 | 3.0 |
| Planning for exact intervals | ||
| Group size for exact intervals within target* | 159 | 214 |
| Total to screen, exact plan | 795 | 268 |
- * The smallest group size from which every larger size, searching up to 500 above Buderer's number, gives an exact interval no wider than the target. Counts are whole numbers, so the exact half-width does not shrink smoothly: for sensitivity the first size within the target is 155, but some sizes just above it miss the target again.* ขนาดกลุ่มที่เล็กที่สุดซึ่งทุกขนาดที่ใหญ่กว่า (ค้นหาขึ้นไปไม่เกิน 500 จากจำนวนของ Buderer) ให้ช่วงความเชื่อมั่นแบบแม่นตรงกว้างไม่เกินเป้าหมาย เนื่องจากจำนวนนับเป็นจำนวนเต็ม ครึ่งความกว้างแบบแม่นตรงจึงไม่ได้ลดลงอย่างราบเรียบ สำหรับความไว ขนาดแรกที่ผ่านเป้าหมายคือ 155 คน แต่ขนาดที่ใหญ่กว่าเล็กน้อยบางค่ากลับไม่ผ่านเป้าหมายอีก
How to read the table. Buderer's formula uses the normal approximation. At 695 people, about 139 will have anaemia, and the exact 95% interval for sensitivity runs from 83.7% to 94.4%: a half-width of 5.4 points, a little wider than the target. Specificity is estimated from 556 people without anaemia, more than it needs, so its half-width is 3.0 points. A buyer who will report exact intervals can plan for 159 people with anaemia, that is 795 people to screen.วิธีอ่านตาราง สูตรของ Buderer อาศัยการประมาณจากการแจกแจงปกติ เมื่อคัดกรอง 695 คน จะมีผู้มีภาวะโลหิตจางประมาณ 139 คน และช่วงความเชื่อมั่น 95% แบบแม่นตรงของความไวอยู่ระหว่าง 83.7% ถึง 94.4% คือมีครึ่งความกว้าง 5.4 จุดร้อยละ กว้างกว่าเป้าหมายเล็กน้อย ส่วนความจำเพาะประมาณจากผู้ไม่มีภาวะโลหิตจาง 556 คน ซึ่งมากกว่าที่ต้องการ ครึ่งความกว้างจึงเป็น 3.0 จุดร้อยละ หากผู้ว่าจ้างจะรายงานช่วงความเชื่อมั่นแบบแม่นตรง อาจวางแผนให้มีผู้มีภาวะโลหิตจาง 159 คน หรือคัดกรองทั้งหมด 795 คน
The total gives 139 people with anaemia only on average. The number found varies from study to study, so a study that screens 695 people has about a 48% chance of finding fewer. Planning to keep screening until 139 (or 159) people with anaemia are enrolled avoids this.จำนวนรวมนี้ให้ผู้มีภาวะโลหิตจาง 139 คนโดยเฉลี่ยเท่านั้น เนื่องจากจำนวนที่พบจริงแปรผันไปในแต่ละการศึกษา การศึกษาที่คัดกรอง 695 คนจึงมีโอกาสประมาณ 48% ที่จะพบผู้มีภาวะโลหิตจางน้อยกว่านี้ การวางแผนคัดกรองต่อไปจนได้ผู้มีภาวะโลหิตจางครบ 139 คน (หรือ 159 คน) จะช่วยป้องกันปัญหานี้
| Prevalence | Total for sensitivity | Total for specificity | Total to screen | Drives the total |
|---|---|---|---|---|
| 5% | 2,780 | 207 | 2,780 | Sensitivity |
| 10% | 1,390 | 218 | 1,390 | Sensitivity |
| 15% | 927 | 231 | 927 | Sensitivity |
| 20% | 695 | 245 | 695 | Sensitivity |
| 25% | 556 | 262 | 556 | Sensitivity |
| 30% | 464 | 280 | 464 | Sensitivity |
| 40% | 348 | 327 | 348 | Sensitivity |
| 50% | 278 | 392 | 392 | Specificity |
- The total for sensitivity is the number of people with anaemia needed divided by the prevalence; the total for specificity is the number without anaemia needed divided by one minus the prevalence. Both are rounded up, and the study needs the larger.จำนวนรวมสำหรับความไว คือจำนวนผู้มีภาวะโลหิตจางที่ต้องการหารด้วยความชุก ส่วนจำนวนรวมสำหรับความจำเพาะ คือจำนวนผู้ไม่มีภาวะโลหิตจางที่ต้องการหารด้วยหนึ่งลบความชุก ทั้งสองค่าปัดขึ้น และการศึกษาต้องใช้ค่าที่มากกว่า
How to read the table. While sensitivity drives the answer, a lower prevalence means more people must be screened to find enough people with anaemia: 2,780 at a prevalence of 5%. Above a prevalence of about 41% the specificity requirement takes over; at 50% the study needs 392. When the prevalence is uncertain, the table shows the size needed at each plausible value.วิธีอ่านตาราง ในช่วงที่ความไวเป็นตัวกำหนดคำตอบ ความชุกที่ต่ำลงหมายความว่าต้องคัดกรองคนมากขึ้นเพื่อให้ได้ผู้มีภาวะโลหิตจางเพียงพอ คือ 2,780 คนที่ความชุก 5% เมื่อความชุกสูงกว่าประมาณ 41% จำนวนที่ต้องใช้เพื่อประมาณความจำเพาะจะเป็นตัวกำหนดแทน ที่ความชุก 50% การศึกษาต้องใช้ 392 คน หากยังไม่แน่ใจเรื่องความชุก ตารางนี้แสดงขนาดตัวอย่างที่ต้องใช้ในแต่ละค่าที่เป็นไปได้
Prediction model with a binary outcomeตัวแบบพยากรณ์ที่มีผลลัพธ์แบบทวิภาค
Assumptions. The clinic expects 15% of adults to miss their next scheduled appointment, will consider 12 candidate predictor parameters (every coefficient counts, including dummy variables and non-linear terms), and anticipates a C-statistic of 0.75.สมมติฐาน คลินิกคาดว่าผู้ใหญ่ 15% จะไม่มาตามนัดครั้งถัดไป จะพิจารณาพารามิเตอร์ของตัวแปรทำนาย 12 พารามิเตอร์ (นับทุกสัมประสิทธิ์ รวมถึงตัวแปรหุ่นและพจน์ที่ไม่เป็นเชิงเส้น) และคาดว่าตัวแบบจะมี C-statistic ประมาณ 0.75
Method. The minimum sample size follows the three criteria of Riley and colleagues for a binary outcome. The first keeps the expected shrinkage of the coefficients at 0.90 or more (small overfitting); the second keeps the difference between the apparent and the adjusted Nagelkerke R squared at 0.05 or less; the third estimates the overall outcome proportion within 0.05. The anticipated C-statistic is converted to a Cox-Snell R squared of 0.103; the largest possible value at this outcome proportion is 0.571. The criteria are written out as formulas in the code and checked against the standard implementation.วิธีคำนวณ ขนาดตัวอย่างขั้นต่ำคำนวณตามเกณฑ์สามข้อของ Riley และคณะสำหรับผลลัพธ์แบบทวิภาค เกณฑ์แรกกำหนดให้ค่าการหดตัว (shrinkage) ที่คาดไว้ของสัมประสิทธิ์ไม่ต่ำกว่า 0.90 เพื่อให้ตัวแบบเกินพอดีกับข้อมูล (overfitting) น้อย เกณฑ์ที่สองกำหนดให้ผลต่างระหว่าง Nagelkerke R squared ที่คำนวณจากข้อมูลที่ใช้สร้างตัวแบบ (apparent) กับค่าที่ปรับแล้ว (adjusted) ไม่เกิน 0.05 และเกณฑ์ที่สามกำหนดให้ประมาณสัดส่วนของผลลัพธ์โดยรวมได้คลาดเคลื่อนไม่เกิน 0.05 ค่า C-statistic ที่คาดไว้ถูกแปลงเป็น Cox-Snell R squared เท่ากับ 0.103 โดยค่าสูงสุดที่เป็นไปได้ที่สัดส่วนผลลัพธ์นี้คือ 0.571 เกณฑ์ทั้งสามเขียนเป็นสูตรไว้ในโค้ดและตรวจเทียบกับโปรแกรมมาตรฐาน
Result. The three criteria need 985, 393 and 196 participants. The answer is the largest, 985 participants with about 148 expected events, or 12.31 events per candidate parameter. Criterion 1, the limit on overfitting, drives the answer. Events per parameter is reported as a result, not used as a fixed rule.ผลการคำนวณ เกณฑ์ทั้งสามต้องใช้ผู้เข้าร่วม 985 คน 393 คน และ 196 คน ตามลำดับ คำตอบคือค่าที่มากที่สุด 985 คน ซึ่งคาดว่าจะมีเหตุการณ์ประมาณ 148 เหตุการณ์ หรือ 12.31 เหตุการณ์ต่อพารามิเตอร์ เกณฑ์ที่ 1 ซึ่งควบคุมการเกินพอดีกับข้อมูลเป็นตัวกำหนดคำตอบ จำนวนเหตุการณ์ต่อพารามิเตอร์รายงานไว้เป็นผลลัพธ์ ไม่ได้ใช้เป็นกฎตายตัว
| Criterion | Sample size | Expected events | Events per parameter |
|---|---|---|---|
| 1. Small overfitting: expected shrinkage at least 0.90 | 985 | 147.75 | 12.31 |
| 2. Small optimism: Nagelkerke R squared difference at most 0.05 | 393 | 58.95 | 4.91 |
| 3. Precise overall risk: margin of error at most 0.05 | 196 | 29.40 | 2.45 |
| Final: the largest of the three | 985 | 147.75 | 12.31 |
- Criteria of Riley and colleagues for a binary outcome, using a Cox-Snell R squared of 0.103 implied by the anticipated C-statistic (maximum 0.571). Expected events are the sample size times the outcome proportion; events per parameter are the expected events divided by the number of candidate parameters.เกณฑ์ของ Riley และคณะสำหรับผลลัพธ์แบบทวิภาค ใช้ Cox-Snell R squared เท่ากับ 0.103 ซึ่งแปลงจาก C-statistic ที่คาดไว้ (ค่าสูงสุด 0.571) จำนวนเหตุการณ์ที่คาดไว้ คือขนาดตัวอย่างคูณด้วยสัดส่วนผลลัพธ์ ส่วนจำนวนเหตุการณ์ต่อพารามิเตอร์ คือจำนวนเหตุการณ์ที่คาดไว้หารด้วยจำนวนพารามิเตอร์ที่พิจารณา
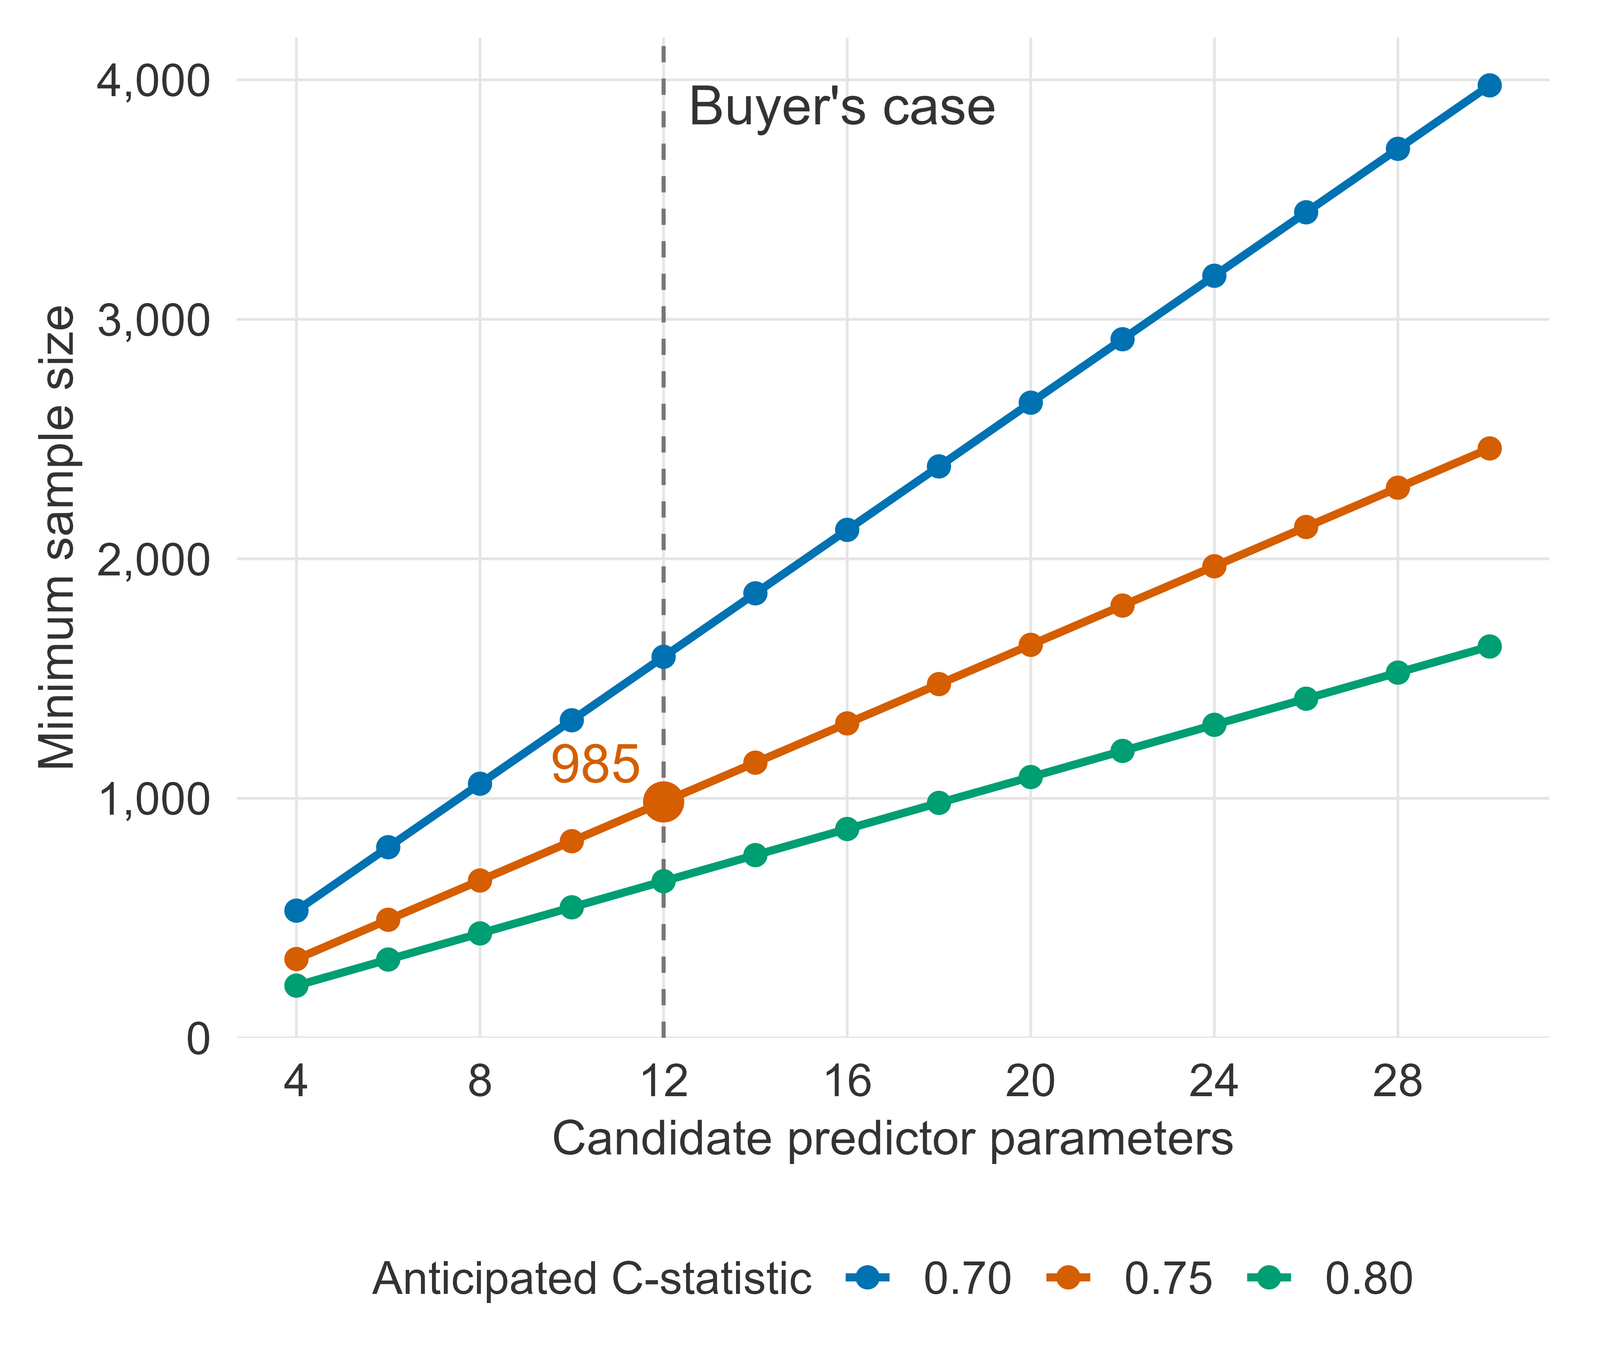
How to read the figure. Every extra candidate parameter adds to the sample size: at 30 parameters the clinic would need 2,461 participants. The anticipated C-statistic also moves the answer: at 12 parameters, a C-statistic of 0.70 needs 1,591 and one of 0.80 needs 654. The overfitting criterion drives the answer at every point shown.วิธีอ่านรูป พารามิเตอร์ที่เพิ่มขึ้นทุกตัวทำให้ขนาดตัวอย่างเพิ่มขึ้น ที่ 30 พารามิเตอร์ คลินิกจะต้องใช้ผู้เข้าร่วม 2,461 คน ค่า C-statistic ที่คาดไว้ก็มีผลต่อคำตอบเช่นกัน ที่ 12 พารามิเตอร์ ถ้า C-statistic เป็น 0.70 ต้องใช้ 1,591 คน และถ้าเป็น 0.80 ต้องใช้ 654 คน เกณฑ์แรกซึ่งควบคุมการเกินพอดีกับข้อมูลเป็นตัวกำหนดคำตอบในทุกจุดของรูป
Limits of this kind of reportข้อจำกัดของรายงานลักษณะนี้
- Each size is for one primary analysis. Several primary endpoints, interim analyses, subgroup analyses or clustering of staff within workplaces need their own adjustment, agreed with the buyer before the calculation.ขนาดตัวอย่างแต่ละค่าคำนวณสำหรับการวิเคราะห์หลักเพียงหนึ่งการวิเคราะห์ หากมีผลลัพธ์หลักหลายตัว การวิเคราะห์ระหว่างการศึกษา (interim analysis) การวิเคราะห์กลุ่มย่อย หรือพนักงานที่อยู่รวมกันเป็นกลุ่มตามสถานที่ทำงาน (clustering) ต้องปรับการคำนวณเพิ่มเติม โดยตกลงกับผู้ว่าจ้างก่อนคำนวณ
- Dividing by one minus the dropout proportion keeps the analysed size, but it does not protect against bias when those who leave differ from those who stay.การหารด้วยหนึ่งลบสัดส่วนผู้ออกจากการศึกษาช่วยรักษาจำนวนที่นำมาวิเคราะห์ได้ แต่ไม่ได้ป้องกันอคติในกรณีที่ผู้ที่ออกจากการศึกษาแตกต่างจากผู้ที่อยู่จนจบ
- The diagnostic calculation assumes that everyone screened receives the reference test and that the people screened resemble those the meter is meant for.การคำนวณของการศึกษาความถูกต้องของการวินิจฉัยตั้งอยู่บนสมมติฐานว่าทุกคนที่ได้รับการคัดกรองได้รับการตรวจมาตรฐานอ้างอิงด้วย และผู้ที่ได้รับการคัดกรองมีลักษณะคล้ายกลุ่มเป้าหมายที่จะใช้เครื่องวัดนี้
- The prediction-model size is a minimum for developing the model; validating it in new data needs its own calculation. Converting the C-statistic to a Cox-Snell R squared is an approximation by simulation, run here with a fixed seed. Across 20 simulation seeds, including the one used here, the answer ranges from 970 to 998; a buyer should plan for the upper end.ขนาดตัวอย่างของตัวแบบพยากรณ์เป็นค่าขั้นต่ำสำหรับการพัฒนาตัวแบบ การตรวจสอบความถูกต้องในข้อมูลชุดใหม่ (validation) ต้องคำนวณแยกต่างหาก การแปลง C-statistic เป็น Cox-Snell R squared เป็นการประมาณด้วยการจำลอง ซึ่งในที่นี้ใช้ค่าตั้งต้นของการสุ่ม (random seed) คงที่ เมื่อใช้ค่าตั้งต้นของการสุ่ม 20 ค่า (รวมค่าที่ใช้ในที่นี้) คำตอบอยู่ระหว่าง 970 ถึง 998 คน ผู้ว่าจ้างควรวางแผนตามค่าสูง
- The report gives sample sizes only. Whether the programme, the meter or the model is worth using is not part of it: that interpretation belongs to the buyer.รายงานนี้ให้เฉพาะขนาดตัวอย่าง ไม่ได้ตัดสินว่าโปรแกรม เครื่องวัด หรือตัวแบบนั้นควรนำไปใช้หรือไม่ การแปลผลดังกล่าวเป็นของผู้ว่าจ้าง
What you send and do yourselfสิ่งที่คุณต้องส่งและทำเอง
- The design, the primary outcome and the smallest effect that would matter clinically.รูปแบบการศึกษา ผลลัพธ์หลัก และขนาดผลที่เล็กที่สุดที่ยังมีความสำคัญทางคลินิก
- Published or pilot values for the expected figures, if you have them.ค่าที่คาดไว้จากงานที่ตีพิมพ์แล้วหรือจากการศึกษานำร่อง ถ้ามี
- The final sample size, and whether it can be recruited, are your decision.การตัดสินใจเรื่องขนาดตัวอย่างสุดท้าย และความเป็นไปได้ในการรับผู้เข้าร่วม เป็นของคุณ
- You acknowledge the statistical help in the way your journal or committee asks.คุณระบุความช่วยเหลือด้านสถิติตามรูปแบบที่วารสารหรือคณะกรรมการกำหนด
Limitsขอบเขตและข้อจำกัด
- Statistical analysis and advice only: the research question, the data, the interpretation and the writing stay yours.บริการนี้เป็นงานวิเคราะห์และให้คำแนะนำทางสถิติเท่านั้น คำถามวิจัย ข้อมูล การแปลผล และการเขียน เป็นของคุณทั้งหมด
- A result is only as sound as its assumptions; I do not change assumptions to reach a convenient number.ผลการคำนวณน่าเชื่อถือได้เพียงเท่าที่สมมติฐานที่ใช้น่าเชื่อถือ ผมจะไม่ปรับสมมติฐานเพื่อให้ได้จำนวนที่สะดวก
- Not for a thesis, an independent study or other work submitted for a degree; for those, I offer consultation only.ไม่รับทำงานที่จะนำไปใช้เพื่อสำเร็จการศึกษา เช่น วิทยานิพนธ์ การค้นคว้าอิสระ หรือผลงานอื่นที่ยื่นเพื่อรับปริญญา งานลักษณะนี้รับเฉพาะการให้คำปรึกษา
- Authorship is not sold and is not a condition of the service.การมีชื่อเป็นผู้นิพนธ์ไม่ใช่สิ่งที่ซื้อขายได้ และไม่ใช่เงื่อนไขในการรับงาน
Request this serviceขอใช้บริการนี้
Every request is reviewed first. I may accept or decline it. The timeline is agreed per project after review.ผมพิจารณาคำขอทุกงานก่อน และอาจรับหรือปฏิเสธงาน ระยะเวลาของแต่ละงานตกลงกันหลังพิจารณาคำขอแล้ว
Member prices apply only to orders that start on uniqcret.com; if you found me on Fastwork or your enquiry began there, please order on Fastwork at the Fastwork price.ราคาสมาชิกใช้กับงานที่เริ่มต้นบน uniqcret.com เท่านั้น หากคุณรู้จักผมจาก Fastwork หรือเริ่มสอบถามบน Fastwork กรุณาสั่งงานบน Fastwork ในราคาของ Fastwork