Prediction model development with internal validationการพัฒนาแบบจำลองพยากรณ์พร้อมการตรวจสอบความถูกต้องภายใน
Prediction model: development with internal validation (bootstrap optimism, calibration)โมเดลทำนาย: การพัฒนาโมเดลพร้อมการตรวจสอบความถูกต้องภายใน (bootstrap optimism และ calibration)
An invented community physiotherapy service runs a 12-week group exercise programme for adults with long-standing knee or hip pain, and wants a model that estimates, at enrolment, each person's risk of not completing it. The outcome is non-completion: stopping attendance before the end of week 12, taken from the attendance register. The cohort is 900 adults who started the programme; 167 of them (18.6%) did not complete it. The analysis plan fixed 7 candidate predictors in advance, all recorded at enrolment: age (years), sex, body mass index (kg/m²), pain score on a 0 to 10 scale, usual travel time to the centre (minutes), work status (not working, part time or full time) and current smoking. The service, the people and every value are invented: all data are simulated with a fixed seed, and the simulated cohort has no missing values.หน่วยกายภาพบำบัดชุมชนสมมุติแห่งหนึ่งจัดโปรแกรมออกกำลังกายแบบกลุ่มระยะเวลา 12 สัปดาห์ สำหรับผู้ใหญ่ที่มีอาการปวดเข่าหรือปวดสะโพกเรื้อรัง และต้องการโมเดลที่ประเมินตั้งแต่วันลงทะเบียนว่าผู้เข้าร่วมแต่ละคนมีความเสี่ยงเท่าใดที่จะเข้าร่วมไม่ครบโปรแกรม ผลลัพธ์คือการเข้าร่วมไม่ครบโปรแกรม (non-completion) หมายถึงหยุดมาเข้าร่วมก่อนสิ้นสัปดาห์ที่ 12 ตามบันทึกการเข้าร่วม กลุ่มตัวอย่างคือผู้ใหญ่ 900 คนที่เริ่มเข้าโปรแกรม ในจำนวนนี้ 167 คน (18.6%) เข้าร่วมไม่ครบโปรแกรม แผนการวิเคราะห์กำหนดตัวทำนายที่จะพิจารณา (candidate predictors) ไว้ล่วงหน้า 7 ตัว ทั้งหมดบันทึกในวันลงทะเบียน ได้แก่ อายุ (ปี) เพศ ดัชนีมวลกาย (kg/m²) คะแนนความปวดในมาตรวัด 0 ถึง 10 เวลาเดินทางตามปกติมายังศูนย์ (นาที) สถานะการทำงาน (ไม่ได้ทำงาน ทำงานบางเวลา หรือทำงานเต็มเวลา) และการสูบบุหรี่ในปัจจุบัน หน่วยบริการ ผู้เข้าร่วม และค่าทุกค่าเป็นเรื่องสมมุติ ข้อมูลทั้งหมดเป็นข้อมูลจำลองที่สร้างด้วย seed คงที่ และกลุ่มตัวอย่างจำลองนี้ไม่มีข้อมูลขาดหาย
What you receiveสิ่งที่คุณจะได้รับ
Developing a prediction model for a binary outcome, with bootstrap internal validation, optimism-corrected performance and calibration, reported against a standard checklist.พัฒนาแบบจำลองพยากรณ์สำหรับผลลัพธ์แบบสองค่า ตรวจสอบความถูกต้องภายในด้วยวิธี bootstrap รายงานประสิทธิภาพที่ปรับ optimism แล้วและการสอบเทียบ (calibration) ตามแนวทางการรายงานมาตรฐาน
- A check that the sample size is enough for the number of candidate predictor parameters, the outcome rate and the expected model fit.การตรวจว่าขนาดตัวอย่างเพียงพอเมื่อพิจารณาจำนวนพารามิเตอร์ของตัวแปรทำนาย อัตราการเกิดผลลัพธ์ และความเหมาะสมของแบบจำลองที่คาดไว้
- The model table and how the predictors were chosen.ตารางแบบจำลอง และวิธีการเลือกตัวแปรทำนาย
- Apparent and optimism-corrected discrimination and calibration.ความสามารถในการจำแนกและการสอบเทียบ ทั้งค่าที่ได้จากข้อมูลชุดพัฒนาและค่าที่ปรับ optimism แล้ว
- A calibration plot, and the items of a reporting checklist such as TRIPOD that the analysis covers.กราฟการสอบเทียบ และรายการในแนวทางการรายงาน เช่น TRIPOD ที่การวิเคราะห์ครอบคลุม
The sampleตัวอย่างงาน
Sample work on simulated data. No real patient, no client project.ตัวอย่างงานจากข้อมูลจำลองทั้งหมด ไม่ใช่ข้อมูลผู้ป่วยจริง และไม่ใช่งานของลูกค้ารายใด
What this sample containsสิ่งที่อยู่ในตัวอย่างนี้
- A sample-size check for the planned number of model parameters, done before any model was fitted.การตรวจขนาดตัวอย่างตามจำนวนพารามิเตอร์ของโมเดลที่วางแผนไว้ ทำก่อนสร้างโมเดลใด ๆ
- The full logistic regression model with every pre-specified predictor and age as a restricted cubic spline: coefficients, odds ratios and 95% confidence intervals, with the age curve written out so the model can be rebuilt (Table 1).โมเดลการถดถอยโลจิสติก (logistic regression) ฉบับเต็มที่มีตัวทำนายครบทุกตัวตามที่กำหนดไว้ล่วงหน้า โดยใส่อายุในรูป restricted cubic spline แสดงค่าสัมประสิทธิ์ odds ratio และช่วงความเชื่อมั่น 95% พร้อมสมการของอายุที่เขียนออกมาครบ เพื่อให้สร้างโมเดลซ้ำได้ (ตารางที่ 1)
- Bootstrap internal validation: apparent, optimism and optimism-corrected values of the C-statistic, calibration slope, calibration intercept and Brier score (Table 2).การตรวจสอบความถูกต้องภายใน (internal validation) ด้วยวิธี bootstrap แสดงค่า apparent ค่า optimism และค่าที่ปรับแก้ optimism แล้ว ของ C-statistic, calibration slope, calibration intercept และ Brier score (ตารางที่ 2)
- A calibration plot with the apparent and bias-corrected curves, the diagonal of perfect calibration and the distribution of predicted risks (Figure 1).กราฟ calibration ที่แสดงเส้นโค้งแบบ apparent และแบบ bias-corrected เส้นทแยงมุมของ calibration ที่สมบูรณ์ และการกระจายของความเสี่ยงที่ทำนายได้ (รูปที่ 1)
- An excerpt of the TRIPOD reporting checklist that shows where each item is addressed (Table 3).รายการตรวจสอบการรายงานตามแนวทาง TRIPOD บางส่วน ระบุว่าแต่ละหัวข้อตอบไว้ที่ส่วนใดของหน้านี้ (ตารางที่ 3)
- A short methods note, a guide to reading each table and figure, and the limits of the analysis.บันทึกวิธีการทางสถิติฉบับย่อ คำอธิบายวิธีอ่านตารางและรูปแต่ละชิ้น และข้อจำกัดของการวิเคราะห์
Sample sizeขนาดตัวอย่าง
Before any model was fitted, the pmsampsize criteria for developing a model with a binary outcome, with 10 candidate parameters, an anticipated outcome proportion of 0.18, an anticipated C-statistic of 0.75 and a target shrinkage factor of 0.90, gave a minimum of 716 participants with 129 events (12.9 events per parameter); the cohort has 900 participants with 167 events (16.7 per parameter), so it meets the minimum.ก่อนสร้างโมเดล ได้ตรวจขนาดตัวอย่างด้วยเกณฑ์ของ pmsampsize สำหรับการพัฒนาโมเดลที่มีผลลัพธ์แบบสองค่า (binary outcome) โดยกำหนดจำนวนพารามิเตอร์ที่วางแผนไว้ 10 ตัว สัดส่วนการเกิดผลลัพธ์ที่คาดไว้ 0.18 ค่า C-statistic ที่คาดไว้ 0.75 และ shrinkage factor เป้าหมาย 0.90 ได้ขนาดตัวอย่างขั้นต่ำ 716 คน ที่มีผู้เกิดผลลัพธ์อย่างน้อย 129 ราย (12.9 รายต่อพารามิเตอร์) ส่วนกลุ่มตัวอย่างนี้มีผู้เข้าร่วม 900 คน และมีผู้เกิดผลลัพธ์ 167 ราย (16.7 รายต่อพารามิเตอร์) จึงผ่านเกณฑ์ขั้นต่ำ
Methods noteสรุปวิธีการทางสถิติ
Model. A logistic regression model was fitted with all 7 pre-specified predictors, 10 parameters in all. Age was entered as a restricted cubic spline with 4 knots, because its relation with the log-odds of non-completion was not expected to be a straight line; the other continuous predictors were entered as linear terms and each categorical predictor as indicator variables against a reference category. No predictor was selected or removed on the basis of P values or any other data-driven step: Table 1 is the full pre-specified model. The analysis used R version 4.6.1 with the packages rms version 8.1.1 and pmsampsize version 1.1.3.โมเดล: สร้างโมเดลการถดถอยโลจิสติกที่มีตัวทำนายครบทั้ง 7 ตัวตามที่กำหนดไว้ล่วงหน้า รวมทั้งหมด 10 พารามิเตอร์ อายุใส่ในโมเดลในรูป restricted cubic spline ที่มี 4 knots เพราะคาดไว้ตั้งแต่ต้นว่าความสัมพันธ์ระหว่างอายุกับ log-odds ของการเข้าร่วมไม่ครบโปรแกรมไม่เป็นเส้นตรง ตัวทำนายต่อเนื่องตัวอื่นใส่เป็นพจน์เชิงเส้น และตัวทำนายเชิงกลุ่มแต่ละตัวใส่เป็นตัวแปรหุ่น (indicator variables) เทียบกับกลุ่มอ้างอิง ไม่มีการคัดเลือกหรือตัดตัวทำนายออกตามค่า P หรือด้วยขั้นตอนใดที่อาศัยข้อมูล ตารางที่ 1 จึงเป็นโมเดลฉบับเต็มตามที่กำหนดไว้ล่วงหน้า การวิเคราะห์ใช้โปรแกรม R เวอร์ชัน 4.6.1 ร่วมกับแพ็กเกจ rms เวอร์ชัน 8.1.1 และ pmsampsize เวอร์ชัน 1.1.3
Internal validation. The bootstrap was used with 500 resamples drawn with a fixed seed. In each resample the whole modelling process was repeated: the full model was refitted in the bootstrap sample, its performance was measured in that sample and again in the original cohort, and the difference between the two is the optimism. The average optimism over all resamples was subtracted from the apparent performance, the performance in the data used to fit the model, to give the optimism-corrected value. Because no step selects predictors, refitting the full model is the whole process; the spline knots stay where they were placed in the full cohort. Discrimination is measured by the C-statistic, calibration by the calibration slope and intercept, and overall accuracy by the Brier score. The calibration curves come from the same kind of bootstrap with 500 resamples, smoothing the observed outcome against the predicted risk with lowess, the default smoother of the calibrate function in rms.การตรวจสอบความถูกต้องภายใน: ใช้วิธี bootstrap จำนวน 500 รอบ โดยสุ่มตัวอย่างซ้ำด้วย seed คงที่ ในแต่ละรอบทำกระบวนการสร้างโมเดลซ้ำทั้งหมด คือฟิตโมเดลฉบับเต็มใหม่ในตัวอย่าง bootstrap แล้ววัดสมรรถนะของโมเดลนั้นทั้งในตัวอย่าง bootstrap และในกลุ่มตัวอย่างเดิม ผลต่างของสองค่านี้คือ optimism จากนั้นนำค่าเฉลี่ยของ optimism จากทุกรอบไปหักออกจากสมรรถนะแบบ apparent (สมรรถนะที่วัดในข้อมูลชุดเดียวกับที่ใช้สร้างโมเดล) ได้เป็นค่าที่ปรับแก้ optimism แล้ว (optimism-corrected) เนื่องจากไม่มีขั้นตอนคัดเลือกตัวทำนาย การฟิตโมเดลฉบับเต็มใหม่จึงครอบคลุมกระบวนการสร้างโมเดลทั้งหมด โดยตำแหน่ง knot ของ spline คงไว้ตามที่กำหนดจากกลุ่มตัวอย่างทั้งหมด ความสามารถในการจำแนก (discrimination) วัดด้วย C-statistic ความสอดคล้องระหว่างความเสี่ยงที่ทำนายกับที่เกิดจริง (calibration) วัดด้วย calibration slope และ calibration intercept และความแม่นยำโดยรวมวัดด้วย Brier score ส่วนเส้นโค้ง calibration ได้จาก bootstrap แบบเดียวกันจำนวน 500 รอบ โดยปรับเรียบ (smoothing) ผลลัพธ์ที่เกิดจริงเทียบกับความเสี่ยงที่ทำนายด้วย lowess ซึ่งเป็นค่าเริ่มต้นของฟังก์ชัน calibrate ในแพ็กเกจ rms
The modelโมเดล
| Predictor | Coefficient (SE) | Odds ratio (95% CI) | P value |
|---|---|---|---|
| Intercept | −1.976 (1.587) | — | — |
| Age (restricted cubic spline, 4 knots) | |||
| Age, spline term 1 | −0.074 (0.031) | — | — |
| Age, spline term 2 | 0.053 (0.096) | — | — |
| Age, spline term 3 | 0.139 (0.369) | — | — |
| Age, overall Wald test (3 df) | — | — | <0.001 |
| Age, non-linear part (2 df) | — | — | <0.001 |
| Other predictors | |||
| Male (reference: female) | −0.291 (0.195) | 0.75 (0.51 to 1.10) | 0.136 |
| Body mass index, per kg/m² | 0.045 (0.022) | 1.05 (1.00 to 1.09) | 0.040 |
| Pain score, per point | 0.320 (0.059) | 1.38 (1.23 to 1.55) | <0.001 |
| Travel time to the centre, per minute | 0.029 (0.005) | 1.03 (1.02 to 1.04) | <0.001 |
| Works part time (reference: not working) | 0.397 (0.262) | 1.49 (0.89 to 2.49) | 0.130 |
| Works full time (reference: not working) | 0.795 (0.237) | 2.21 (1.39 to 3.53) | <0.001 |
| Current smoker (reference: no) | 0.716 (0.235) | 2.05 (1.29 to 3.24) | 0.002 |
- Age enters as a restricted cubic spline with knots at 44, 56, 64 and 76.05 years, the default percentiles of rms. The second and third spline terms are on the scaled restricted basis that rms uses, so no spline coefficient can be read on its own and none has an odds ratio; the two Wald tests below them test age as a whole and its non-linear part.อายุใส่ในรูป restricted cubic spline ที่มี knot ที่อายุ 44, 56, 64 และ 76.05 ปี ตามเปอร์เซ็นไทล์ค่าเริ่มต้นของ rms พจน์ที่สองและที่สามของ spline อยู่บนฐาน (basis) แบบปรับมาตราส่วนที่ rms ใช้ จึงอ่านค่าสัมประสิทธิ์ของ spline แยกทีละตัวไม่ได้ และไม่มี odds ratio ในตัวเอง ให้อ่าน Wald test สองค่าที่อยู่ใต้พจน์เหล่านั้น ซึ่งทดสอบผลของอายุโดยรวมและส่วนที่ไม่เป็นเส้นตรง
- Written out, the age part of the log-odds is a × age plus, for each knot, b × ((age − knot)/10)³, where each cubed term counts only when age is above its knot and is zero otherwise. Here a = −0.07431, and b = 0.05168, 0.13548, −0.36287 and 0.17572 at the knots 44, 56, 64 and 76.05 years. These five numbers give the same age curve as the three spline terms, up to rounding.เมื่อเขียนเป็นสมการ ส่วนของอายุใน log-odds เท่ากับ a × อายุ บวกกับ b × ((อายุ − knot)/10)³ ของแต่ละ knot โดยพจน์กำลังสามแต่ละพจน์นับเฉพาะเมื่ออายุมากกว่า knot ของพจน์นั้น และเป็นศูนย์ในกรณีอื่น ในที่นี้ a = −0.07431 และ b = 0.05168, 0.13548, −0.36287 และ 0.17572 ที่ knot อายุ 44, 56, 64 และ 76.05 ปี ตามลำดับ ตัวเลขห้าตัวนี้ให้เส้นโค้งของอายุเดียวกับพจน์ของ spline ทั้งสามพจน์ โดยต่างกันเพียงจากการปัดเศษ
- Odds ratios are per one unit of a continuous predictor, or against the reference category, with every other predictor held fixed; confidence intervals and P values are Wald. SE, standard error; CI, confidence interval; df, degrees of freedom.odds ratio คิดต่อหนึ่งหน่วยของตัวทำนายต่อเนื่อง หรือเทียบกับกลุ่มอ้างอิง เมื่อตัวทำนายอื่นคงที่ ช่วงความเชื่อมั่นและค่า P เป็นแบบ Wald โดย SE คือความคลาดเคลื่อนมาตรฐาน (standard error) CI คือช่วงความเชื่อมั่น (confidence interval) และ df คือองศาอิสระ (degrees of freedom)
- With the intercept, every coefficient and the age function written out, the model can be rebuilt in full and tested by others in new data.เมื่อมีค่าจุดตัด (intercept) ค่าสัมประสิทธิ์ทุกตัว และสมการของอายุครบ ผู้อื่นจึงเขียนสมการของโมเดลได้ครบและนำไปทดสอบกับข้อมูลชุดใหม่ได้
How to read it: each row is one model parameter. The coefficient is on the log-odds scale and the odds ratio is its exponential. For example, a one-point higher pain score at enrolment goes with an odds ratio for non-completion of 1.38 (95% CI 1.23 to 1.55), with the other predictors held fixed. Age has no single odds ratio because its effect is a curve: read the overall test (P < 0.001) and the test of its non-linear part (P < 0.001) instead. In a prediction model the coefficients serve the prediction; they are not causal effects of the predictors.วิธีอ่าน: แต่ละแถวคือพารามิเตอร์หนึ่งตัวของโมเดล ค่าสัมประสิทธิ์อยู่ในมาตรา log-odds และ odds ratio คือค่า exponential ของค่าสัมประสิทธิ์ ตัวอย่างเช่น คะแนนความปวดตอนลงทะเบียนที่สูงขึ้นหนึ่งคะแนนสัมพันธ์กับ odds ratio ของการเข้าร่วมไม่ครบโปรแกรมเท่ากับ 1.38 (95% CI 1.23 ถึง 1.55) เมื่อตัวทำนายอื่นคงที่ ส่วนอายุไม่มี odds ratio ค่าเดียว เพราะผลของอายุเป็นเส้นโค้ง ให้อ่านผลการทดสอบโดยรวม (P < 0.001) และผลการทดสอบส่วนที่ไม่เป็นเส้นตรง (P < 0.001) แทน ในโมเดลทำนาย ค่าสัมประสิทธิ์มีไว้เพื่อการทำนาย ไม่ได้แสดงผลเชิงสาเหตุของตัวทำนาย
Performance: apparent and optimism-correctedสมรรถนะของโมเดล: ค่า apparent และค่าที่ปรับแก้ optimism แล้ว
| Measure | Apparent | Optimism | Optimism-corrected | 95% CI, corrected |
|---|---|---|---|---|
| C-statistic | 0.743 | 0.018 | 0.725 | 0.686 to 0.764 |
| Calibration slope | 1.000 | 0.090 | 0.910 | 0.705 to 1.150 |
| Calibration intercept (slope estimated jointly) | 0.000 | 0.119 | −0.119 | −0.437 to 0.222 |
| Brier score | 0.131 | −0.004 | 0.135 | 0.121 to 0.151 |
- Apparent: the model tested in the data it was fitted to. Optimism: the average, over resamples, of performance in the bootstrap sample minus performance of the same refitted model in the original cohort. Optimism-corrected = apparent − optimism.Apparent คือสมรรถนะของโมเดลเมื่อทดสอบในข้อมูลชุดเดียวกับที่ใช้สร้างโมเดล Optimism คือค่าเฉลี่ยจากทุกรอบของสมรรถนะในตัวอย่าง bootstrap ลบด้วยสมรรถนะของโมเดลเดียวกันนั้นเมื่อทดสอบในกลุ่มตัวอย่างเดิม ค่าที่ปรับแก้แล้ว (optimism-corrected) = apparent − optimism
- By definition the apparent calibration slope is 1.000 and the apparent calibration intercept is 0.000. This intercept is estimated together with the slope and is not calibration-in-the-large; it shows only how the line through the predictions shifts once the slope is allowed to change, so read it with the slope. For the Brier score lower is better, so its optimism is negative.ตามนิยาม calibration slope แบบ apparent เท่ากับ 1.000 และ calibration intercept แบบ apparent เท่ากับ 0.000 เสมอ ค่า intercept นี้ประมาณร่วมกับ slope จึงไม่ใช่ calibration-in-the-large แต่แสดงเพียงว่าเส้นที่ลากผ่านค่าทำนายเลื่อนไปเท่าใดเมื่อยอมให้ slope เปลี่ยนได้ ให้อ่านคู่กับ slope เสมอ สำหรับ Brier score ค่ายิ่งต่ำยิ่งดี optimism ของ Brier score จึงมีค่าติดลบ
- The 95% CI limits are approximate bootstrap limits for the optimism-corrected values, from the same 500 resamples, computed with the method built into rms version 8.1.1. CI, confidence interval.ขอบเขตของช่วงความเชื่อมั่น 95% เป็นค่าประมาณจาก bootstrap สำหรับค่าที่ปรับแก้ optimism แล้ว จากการสุ่มซ้ำ 500 รอบชุดเดียวกัน คำนวณด้วยวิธีที่มีอยู่ในแพ็กเกจ rms เวอร์ชัน 8.1.1 โดย CI คือช่วงความเชื่อมั่น (confidence interval)
How to read it: the optimism-corrected values estimate how the model would perform in new people from the same population, so they are the values to report. The corrected C-statistic is 0.725 against an apparent 0.743: the optimism of 0.018 is the part of the apparent discrimination that came from fitting this sample. The corrected calibration slope is 0.910, below 1.000: in new data the predictions are expected to be somewhat too extreme, with high risks a little too high and low risks a little too low, the usual sign of overfitting; the slope can serve as a uniform shrinkage factor for the coefficients, with the intercept re-estimated afterwards, if the model is taken further. The corrected Brier score is 0.135; read it against 0.151, the Brier score of a model that gives every participant the cohort's outcome proportion.วิธีอ่าน: ค่าที่ปรับแก้ optimism แล้วเป็นค่าประมาณสมรรถนะของโมเดลเมื่อใช้กับคนกลุ่มใหม่จากประชากรเดียวกัน จึงเป็นค่าที่ควรรายงาน C-statistic ที่ปรับแก้แล้วเท่ากับ 0.725 เทียบกับค่า apparent 0.743 ส่วนต่าง optimism 0.018 คือส่วนของความสามารถในการจำแนกที่ได้มาจากการฟิตโมเดลกับข้อมูลชุดนี้เอง calibration slope ที่ปรับแก้แล้วเท่ากับ 0.910 ซึ่งต่ำกว่า 1.000 หมายความว่าเมื่อใช้กับข้อมูลใหม่ ความเสี่ยงที่ทำนายได้มีแนวโน้มสุดโต่งเกินไปเล็กน้อย คือความเสี่ยงที่สูงถูกทำนายสูงเกินไปและความเสี่ยงที่ต่ำถูกทำนายต่ำเกินไป ซึ่งเป็นสัญญาณที่พบได้ทั่วไปของ overfitting หากจะพัฒนาโมเดลต่อ สามารถใช้ค่า slope นี้เป็น shrinkage factor ปรับค่าสัมประสิทธิ์ทุกตัวในอัตราเดียวกัน แล้วประมาณค่า intercept ใหม่ Brier score ที่ปรับแก้แล้วเท่ากับ 0.135 ให้อ่านเทียบกับ 0.151 ซึ่งเป็น Brier score ของโมเดลที่ให้ความเสี่ยงของทุกคนเท่ากับสัดส่วนการเกิดผลลัพธ์ของกลุ่มตัวอย่าง
Calibrationความสอดคล้องของความเสี่ยงที่ทำนาย (calibration)
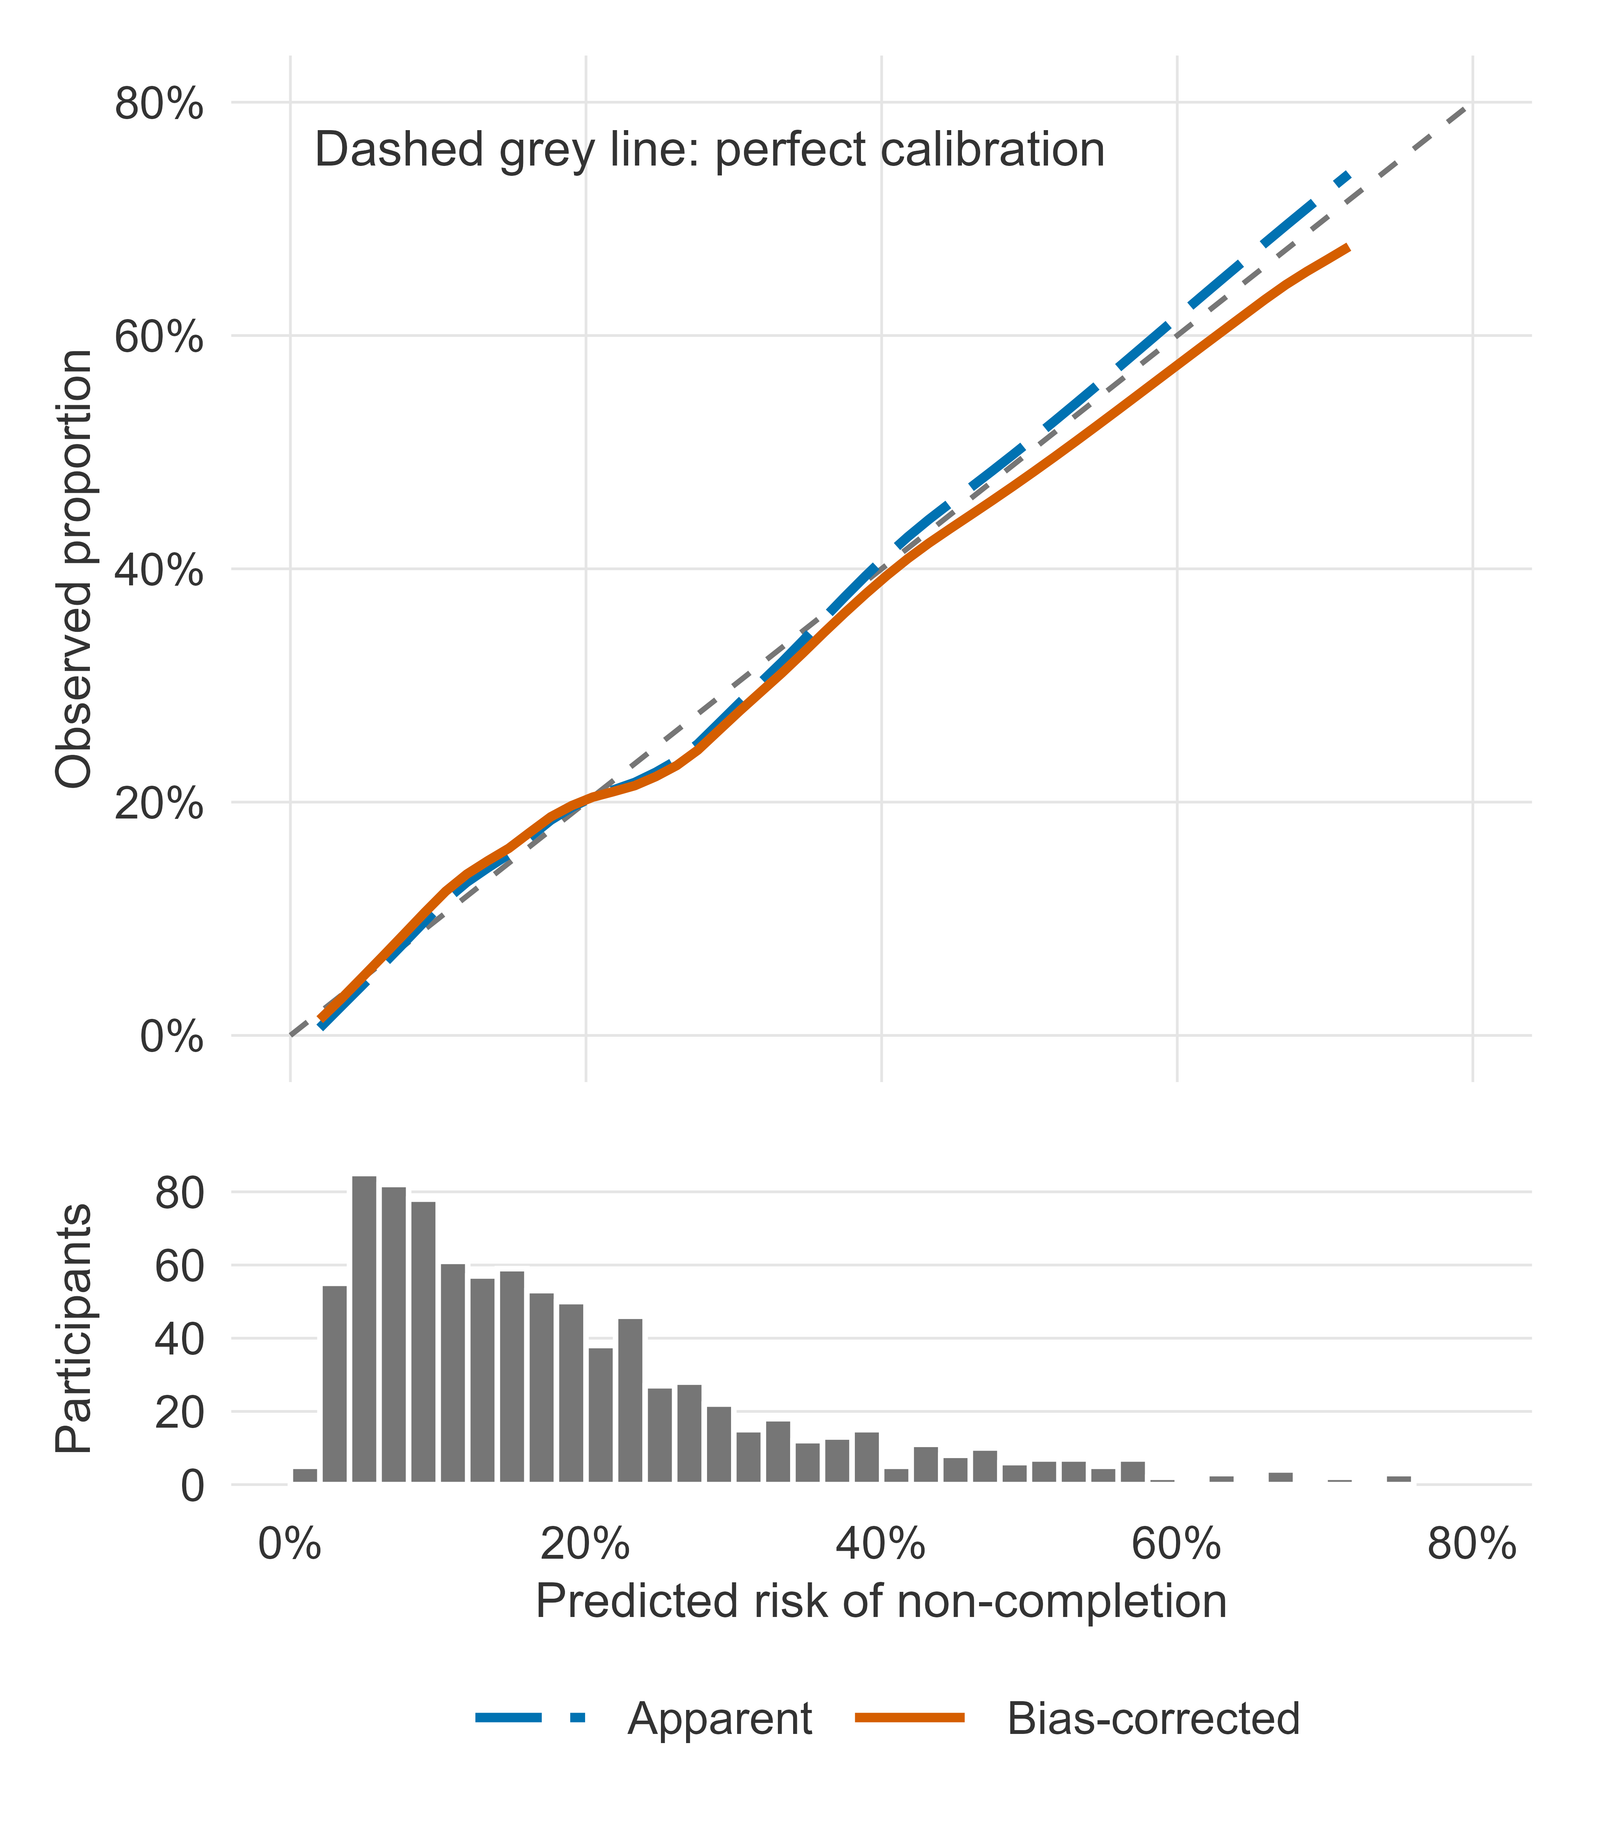
How to read it: the curve of a perfectly calibrated model lies on the dashed diagonal, where among people given a predicted risk of one in five, one in five do not complete. The apparent curve uses the same data as the fit; the bias-corrected curve removes the bootstrap optimism and is the one to judge. Where the bias-corrected curve lies below the diagonal the model predicts too high a risk, and where it lies above, too low. In this sample both curves stay close to the diagonal at predicted risks below one in five; above that the bias-corrected curve lies a little below it, most at the highest predicted risks, so those risks are slightly overestimated. The histogram shows where the predictions fall: predicted risks run from 1.5% to 75.7%, most of them are low, and the curves are least certain where few participants are.วิธีอ่าน: เส้นโค้งของโมเดลที่ calibration สมบูรณ์จะทับเส้นทแยงมุมประ หมายความว่าในกลุ่มคนที่โมเดลทำนายความเสี่ยงไว้หนึ่งในห้า จะมีหนึ่งในห้าที่เข้าร่วมไม่ครบโปรแกรมจริง เส้นโค้ง apparent ใช้ข้อมูลชุดเดียวกับที่ใช้ฟิตโมเดล ส่วนเส้นโค้ง bias-corrected หัก optimism จาก bootstrap ออกแล้ว จึงเป็นเส้นที่ควรใช้ประเมิน ช่วงที่เส้น bias-corrected อยู่ต่ำกว่าเส้นทแยงมุม โมเดลทำนายความเสี่ยงสูงเกินจริง และช่วงที่อยู่เหนือเส้นทแยงมุม โมเดลทำนายต่ำเกินจริง ในตัวอย่างนี้ เส้นโค้งทั้งสองอยู่ใกล้เส้นทแยงมุมในช่วงความเสี่ยงที่ทำนายต่ำกว่าหนึ่งในห้า เมื่อสูงกว่านั้น เส้น bias-corrected อยู่ต่ำกว่าเส้นทแยงมุมเล็กน้อย และห่างมากที่สุดในช่วงความเสี่ยงที่ทำนายสูงสุด จึงทำนายความเสี่ยงในช่วงนั้นสูงเกินจริงเล็กน้อย ฮิสโทแกรมแสดงว่าความเสี่ยงที่ทำนายส่วนใหญ่อยู่ช่วงใด โดยความเสี่ยงที่ทำนายมีค่าตั้งแต่ 1.5% ถึง 75.7% ส่วนใหญ่มีค่าต่ำ และเส้นโค้งมีความไม่แน่นอนมากที่สุดในช่วงที่มีผู้เข้าร่วมน้อย
Reporting checklist (excerpt)รายการตรวจสอบการรายงาน (บางส่วน)
| TRIPOD item | What the item asks | Where this sample addresses it |
|---|---|---|
| 6a | Define the outcome, and say how and when it was assessed | Scenario: non-completion, stopping attendance before the end of the programme |
| 7a | Define every predictor, and say how and when it was measured | Scenario: every predictor and its unit, all recorded at enrolment |
| 8 | Explain how the study size was arrived at | Sample size: the pmsampsize check, done before any model was fitted |
| 10a | Describe how each predictor was handled in the analysis | Methods note and Table 1: age as a restricted cubic spline, other continuous predictors linear, categories against a reference |
| 10b | State the model type, every model-building step including any predictor selection, and the internal validation method | Methods note: logistic regression with all pre-specified predictors, no selection; bootstrap repeating the whole modelling process |
| 10d | List every measure used to judge model performance | Methods note, Table 2 and Figure 1: C-statistic, calibration slope and intercept, Brier score, calibration curve |
| 14a | Give the number of participants and outcome events in the analysis | Scenario and Sample size: participants and events of the cohort |
| 15a | Present the full model: every coefficient and the intercept | Table 1, with the spline knots and the age function written out in its footnotes |
| 16 | Report the performance measures, with confidence intervals | Table 2 (with approximate bootstrap limits) and Figure 1 |
| 18 | Discuss the limitations | Limits at the end of this page |
- Items are paraphrased, not quoted, and numbered as in the original TRIPOD statement. The newer TRIPOD+AI checklist numbers its items differently; a full delivery follows the version the target journal asks for.หัวข้อเรียบเรียงใหม่ ไม่ได้คัดลอกข้อความต้นฉบับ และใช้เลขหัวข้อตามแนวทาง TRIPOD ฉบับดั้งเดิม แนวทาง TRIPOD+AI ที่ใหม่กว่าใช้เลขหัวข้อต่างออกไป งานที่ส่งมอบจริงจะใช้ฉบับที่วารสารเป้าหมายกำหนด
How to read it: the left column is the item number, the middle column says in short what the item asks, and the right column names the part of this page that answers it. In a full delivery the checklist covers every item that applies and points to the section of the analysis report; the page numbers of the manuscript are added by the authors.วิธีอ่าน: คอลัมน์ซ้ายคือเลขหัวข้อ คอลัมน์กลางสรุปสั้น ๆ ว่าหัวข้อนั้นถามอะไร และคอลัมน์ขวาระบุส่วนของหน้านี้ที่ตอบหัวข้อนั้น ในงานที่ส่งมอบจริง รายการตรวจสอบจะครอบคลุมทุกหัวข้อที่เกี่ยวข้องและชี้ไปยังส่วนของรายงานผลการวิเคราะห์ ส่วนเลขหน้าในต้นฉบับบทความ ผู้นิพนธ์เป็นผู้เติมเอง
Limits of this sample. The validation is internal only: no external validation in another service, place or period was done, so how well the model transports elsewhere is unknown. No variable selection by P values was done, and any selection added later would have to be repeated inside every bootstrap resample. The simulated cohort has no missing values; real data with missing values would need multiple imputation built into the validation. A model that validates well internally is not ready for use in care or in the running of a service: that needs external validation and a check of its clinical usefulness and impact.ข้อจำกัดของตัวอย่างนี้: การตรวจสอบความถูกต้องเป็นแบบภายในเท่านั้น ยังไม่มีการตรวจสอบความถูกต้องภายนอก (external validation) ในหน่วยบริการ สถานที่ หรือช่วงเวลาอื่น จึงยังไม่ทราบว่าโมเดลจะใช้ได้ดีเพียงใดในบริบทอื่น ไม่มีการคัดเลือกตัวแปรด้วยค่า P และหากจะเพิ่มขั้นตอนคัดเลือกภายหลัง ต้องทำขั้นตอนนั้นซ้ำในทุกรอบของ bootstrap ด้วย กลุ่มตัวอย่างจำลองนี้ไม่มีข้อมูลขาดหาย หากข้อมูลจริงมีข้อมูลขาดหาย ต้องใช้ multiple imputation ร่วมกับกระบวนการตรวจสอบความถูกต้อง โมเดลที่ผ่านการตรวจสอบความถูกต้องภายในได้ดียังไม่พร้อมนำไปใช้ในการดูแลหรือในงานบริการจริง ต้องผ่านการตรวจสอบความถูกต้องภายนอก และการประเมินประโยชน์ทางคลินิกและผลกระทบก่อน
Interpretation belongs to the buyer. This sample shows how the analysis is done and reported; what the model means for the service, and whether it should be taken further, is for the research team to decide.การแปลผลเป็นหน้าที่ของผู้ว่าจ้าง ตัวอย่างนี้แสดงวิธีวิเคราะห์และวิธีรายงานผล ส่วนความหมายของโมเดลต่อหน่วยบริการ และควรพัฒนาโมเดลต่อหรือไม่ เป็นการตัดสินใจของทีมวิจัย
What you send and do yourselfสิ่งที่คุณต้องส่งและทำเอง
- The outcome and the candidate predictors, with the clinical reason for each.ผลลัพธ์และตัวแปรทำนายที่ต้องการพิจารณา พร้อมเหตุผลทางคลินิกของแต่ละตัว
- A de-identified dataset with its codebook: no names, ID numbers, addresses or anything else that identifies a person.ชุดข้อมูลที่ตัดข้อมูลระบุตัวตนออกแล้ว พร้อมคู่มือรหัสตัวแปร (codebook) โดยไม่มีชื่อ เลขประจำตัว ที่อยู่ หรือข้อมูลอื่นที่ระบุตัวบุคคลได้
- You interpret the results and write your own article, and acknowledge the statistical help in the way your journal asks.คุณเป็นผู้แปลผลและเขียนบทความของคุณเอง และระบุความช่วยเหลือด้านสถิติตามรูปแบบที่วารสารกำหนด
Limitsขอบเขตและข้อจำกัด
- Statistical analysis and advice only: the research question, the data, the interpretation and the writing stay yours.บริการนี้เป็นงานวิเคราะห์และให้คำแนะนำทางสถิติเท่านั้น คำถามวิจัย ข้อมูล การแปลผล และการเขียน เป็นของคุณทั้งหมด
- Internal validation only; external validation in a new population is a separate study.เป็นการตรวจสอบความถูกต้องภายในเท่านั้น การตรวจสอบภายนอกในประชากรกลุ่มใหม่เป็นอีกการศึกษาหนึ่ง
- Machine-learning models are not offered at present.ขณะนี้ยังไม่รับงานแบบจำลองด้วยวิธี machine learning
- The model is for research; it is not a tool for patient-care decisions.แบบจำลองนี้ใช้เพื่องานวิจัย ไม่ใช่เครื่องมือสำหรับตัดสินใจในการดูแลผู้ป่วย
- Not for a thesis, an independent study or other work submitted for a degree; for those, I offer consultation only.ไม่รับทำงานที่จะนำไปใช้เพื่อสำเร็จการศึกษา เช่น วิทยานิพนธ์ การค้นคว้าอิสระ หรือผลงานอื่นที่ยื่นเพื่อรับปริญญา งานลักษณะนี้รับเฉพาะการให้คำปรึกษา
- Authorship is not sold and is not a condition of the service.การมีชื่อเป็นผู้นิพนธ์ไม่ใช่สิ่งที่ซื้อขายได้ และไม่ใช่เงื่อนไขในการรับงาน
Request this serviceขอใช้บริการนี้
Every request is reviewed first. I may accept or decline it. The timeline is agreed per project after review.ผมพิจารณาคำขอทุกงานก่อน และอาจรับหรือปฏิเสธงาน ระยะเวลาของแต่ละงานตกลงกันหลังพิจารณาคำขอแล้ว
Member prices apply only to orders that start on uniqcret.com; if you found me on Fastwork or your enquiry began there, please order on Fastwork at the Fastwork price.ราคาสมาชิกใช้กับงานที่เริ่มต้นบน uniqcret.com เท่านั้น หากคุณรู้จักผมจาก Fastwork หรือเริ่มสอบถามบน Fastwork กรุณาสั่งงานบน Fastwork ในราคาของ Fastwork