Meta-analysis and network meta-analysisการวิเคราะห์อภิมานและการวิเคราะห์อภิมานแบบเครือข่าย
Meta-analysis and network meta-analysis: a demonstration on simulated trialsการวิเคราะห์อภิมาน (meta-analysis) และการวิเคราะห์อภิมานแบบเครือข่าย (network meta-analysis): ตัวอย่างสาธิตจากข้อมูลการทดลองจำลอง
This page is a demonstration, not past work. An invented review team asks a statistician to pool randomised trials of exercise for adults with chronic low back pain seen in primary care. The outcome is binary: whether a participant still reports activity-limiting back pain 12 weeks after randomisation, so an odds ratio below 1 means fewer participants still in pain. Part A pools 12 two-arm trials (2,552 participants) that compare a structured exercise programme with usual care. Part B joins 14 trials (2,685 participants) of 5 options in one network: usual care, education, home exercise, group exercise and yoga. The review question, the trials and every number are invented, and all trial results are simulated with a fixed seed.หน้านี้เป็นตัวอย่างสาธิต ไม่ใช่ผลงานที่เคยทำให้ลูกค้า ทีมทบทวนวรรณกรรมสมมุติทีมหนึ่งขอให้นักสถิติรวมผลการทดลองแบบสุ่มเรื่องการออกกำลังกายในผู้ใหญ่ที่มีอาการปวดหลังส่วนล่างเรื้อรังซึ่งมารับบริการที่หน่วยบริการปฐมภูมิ ผลลัพธ์เป็นตัวแปรแบบสองค่า (binary) คือผู้เข้าร่วมยังมีอาการปวดหลังจนจำกัดกิจกรรมหรือไม่ เมื่อครบ 12 สัปดาห์หลังการสุ่ม ดังนั้น odds ratio น้อยกว่า 1 หมายถึงมีผู้ที่ยังปวดอยู่น้อยกว่า ส่วน A รวมผลการทดลองแบบสองกลุ่ม 12 การทดลอง (ผู้เข้าร่วม 2,552 คน) ที่เปรียบเทียบโปรแกรมออกกำลังกายแบบมีโครงสร้างกับการดูแลตามปกติ ส่วน B นำการทดลอง 14 การทดลอง (ผู้เข้าร่วม 2,685 คน) ของทางเลือก 5 ทาง มาวิเคราะห์ในเครือข่ายเดียว ได้แก่ การดูแลตามปกติ การให้ความรู้ การออกกำลังกายที่บ้าน การออกกำลังกายเป็นกลุ่ม และโยคะ คำถามการทบทวน การทดลอง และตัวเลขทุกค่าเป็นเรื่องสมมุติ ผลการทดลองทั้งหมดเป็นข้อมูลจำลองที่สร้างด้วย seed คงที่
What you receiveสิ่งที่คุณจะได้รับ
Pooling the study results your team has extracted: pairwise meta-analysis with heterogeneity and subgroup analyses, and network meta-analysis where the trials connect into a network. Offered as a special case and reviewed request by request.รวมผลการศึกษาจากข้อมูลที่ทีมของคุณสกัดไว้ ทั้งการวิเคราะห์อภิมานแบบเปรียบเทียบคู่ พร้อมการประเมินความแตกต่างระหว่างการศึกษาและการวิเคราะห์กลุ่มย่อย และการวิเคราะห์อภิมานแบบเครือข่ายเมื่อการศึกษาเชื่อมโยงกันเป็นเครือข่าย รับเป็นกรณีพิเศษและพิจารณาเป็นรายคำขอ
- Forest plots, and a funnel plot when there are enough studies (usually 10 or more).กราฟ forest plot และกราฟ funnel plot เมื่อมีจำนวนการศึกษาเพียงพอ (โดยทั่วไปตั้งแต่ 10 การศึกษาขึ้นไป)
- Heterogeneity (tau², I² and a prediction interval) and subgroup analyses.ความแตกต่างระหว่างการศึกษา (heterogeneity: tau², I² และช่วงพยากรณ์) และการวิเคราะห์กลุ่มย่อย
- For a network: the network plot, a check of consistency between direct and indirect evidence, a league table and a ranking of the treatments.สำหรับการวิเคราะห์แบบเครือข่าย ได้แก่ แผนภาพเครือข่าย การตรวจความสอดคล้องระหว่างหลักฐานทางตรงและทางอ้อม ตาราง league table และการจัดอันดับการรักษา
- A short record of the methods used.บันทึกสั้น ๆ ของวิธีการทางสถิติที่ใช้
The sampleตัวอย่างงาน
Sample work on simulated data. No real patient, no client project.ตัวอย่างงานจากข้อมูลจำลองทั้งหมด ไม่ใช่ข้อมูลผู้ป่วยจริง และไม่ใช่งานของลูกค้ารายใด
A demonstration, not a track record. No past client work is claimed for this service. The page works through simulated trials to show what a meta-analysis job delivers and how each output is read.เป็นตัวอย่างสาธิต ไม่ใช่การแสดงผลงานที่ผ่านมา บริการนี้ไม่ได้อ้างผลงานจากลูกค้าในอดีต หน้านี้ใช้การทดลองจำลองเพื่อแสดงว่างานวิเคราะห์อภิมานหนึ่งงานส่งมอบอะไรบ้าง และควรอ่านผลแต่ละชิ้นอย่างไร
What a meta-analysis job deliversสิ่งที่ผู้ว่าจ้างได้รับจากงานวิเคราะห์อภิมาน
- A short methods note for each analysis: the effect measure, the model, the estimator of the between-trial variance and the method for the confidence interval.บันทึกวิธีการแบบสั้นของแต่ละการวิเคราะห์ ได้แก่ ตัววัดผล (effect measure) โมเดลที่ใช้ วิธีประมาณความแปรปรวนระหว่างการทดลอง และวิธีคำนวณช่วงความเชื่อมั่น
- Pairwise meta-analysis: a forest plot with a prediction interval, the heterogeneity statistics, a subgroup analysis, and a funnel plot with an asymmetry test when there are enough trials.การวิเคราะห์อภิมานแบบเปรียบเทียบสองกลุ่ม: forest plot พร้อม prediction interval ค่าสถิติของความแตกต่างระหว่างการทดลอง (heterogeneity) การวิเคราะห์กลุ่มย่อย และ funnel plot พร้อมการทดสอบความไม่สมมาตรเมื่อมีจำนวนการทดลองมากพอ
- Network meta-analysis: a network graph, a league table of every pairwise estimate, a ranking table, and a check that direct and indirect evidence agree.การวิเคราะห์อภิมานแบบเครือข่าย: กราฟเครือข่าย ตารางเปรียบเทียบทุกคู่ (league table) ตารางจัดอันดับ และการตรวจว่าหลักฐานทางตรงและทางอ้อมสอดคล้องกัน
- A note on how to read each table and figure, and the limits of the analysis. Interpretation and conclusions stay with the review team.คำอธิบายวิธีอ่านตารางและรูปแต่ละชิ้น และข้อจำกัดของการวิเคราะห์ ส่วนการแปลผลและการสรุปเป็นหน้าที่ของทีมทบทวนวรรณกรรม
Part A: pairwise meta-analysisส่วน A: การวิเคราะห์อภิมานแบบเปรียบเทียบสองกลุ่ม (pairwise meta-analysis)
Methods note. The effect measure is the odds ratio of still being in pain, exercise against usual care. Trials were pooled in a random-effects model with inverse-variance weights. The between-trial variance, τ², was estimated by restricted maximum likelihood (REML), and the 95% CI of the pooled odds ratio uses the Hartung-Knapp method, which carries the uncertainty in τ² and is usually wider than the classical normal interval when trials are few. The 95% prediction interval uses a t distribution with 10 degrees of freedom and shows where the true effect of a new trial like these is expected to lie, assuming that true effects are normally distributed across trials.บันทึกวิธีการ ตัววัดผลคือ odds ratio ของการยังมีอาการปวด เปรียบเทียบกลุ่มออกกำลังกายกับกลุ่มการดูแลตามปกติ รวมผลการทดลองด้วยโมเดลแบบ random effects โดยถ่วงน้ำหนักแบบ inverse variance ประมาณความแปรปรวนระหว่างการทดลอง (τ²) ด้วยวิธี restricted maximum likelihood (REML) และคำนวณช่วงความเชื่อมั่น 95% ของ odds ratio รวมด้วยวิธี Hartung-Knapp ซึ่งนำความไม่แน่นอนของ τ² มาคิดด้วย จึงมักกว้างกว่าช่วงแบบ normal ดั้งเดิมเมื่อมีการทดลองไม่มาก ส่วน prediction interval 95% คำนวณจากการแจกแจง t ที่มีองศาอิสระ 10 และบอกช่วงที่คาดว่าผลจริงของการทดลองใหม่ที่มีลักษณะคล้ายกันจะตกอยู่ โดยสมมติว่าผลจริงของการทดลองต่าง ๆ มีการแจกแจงแบบปกติ
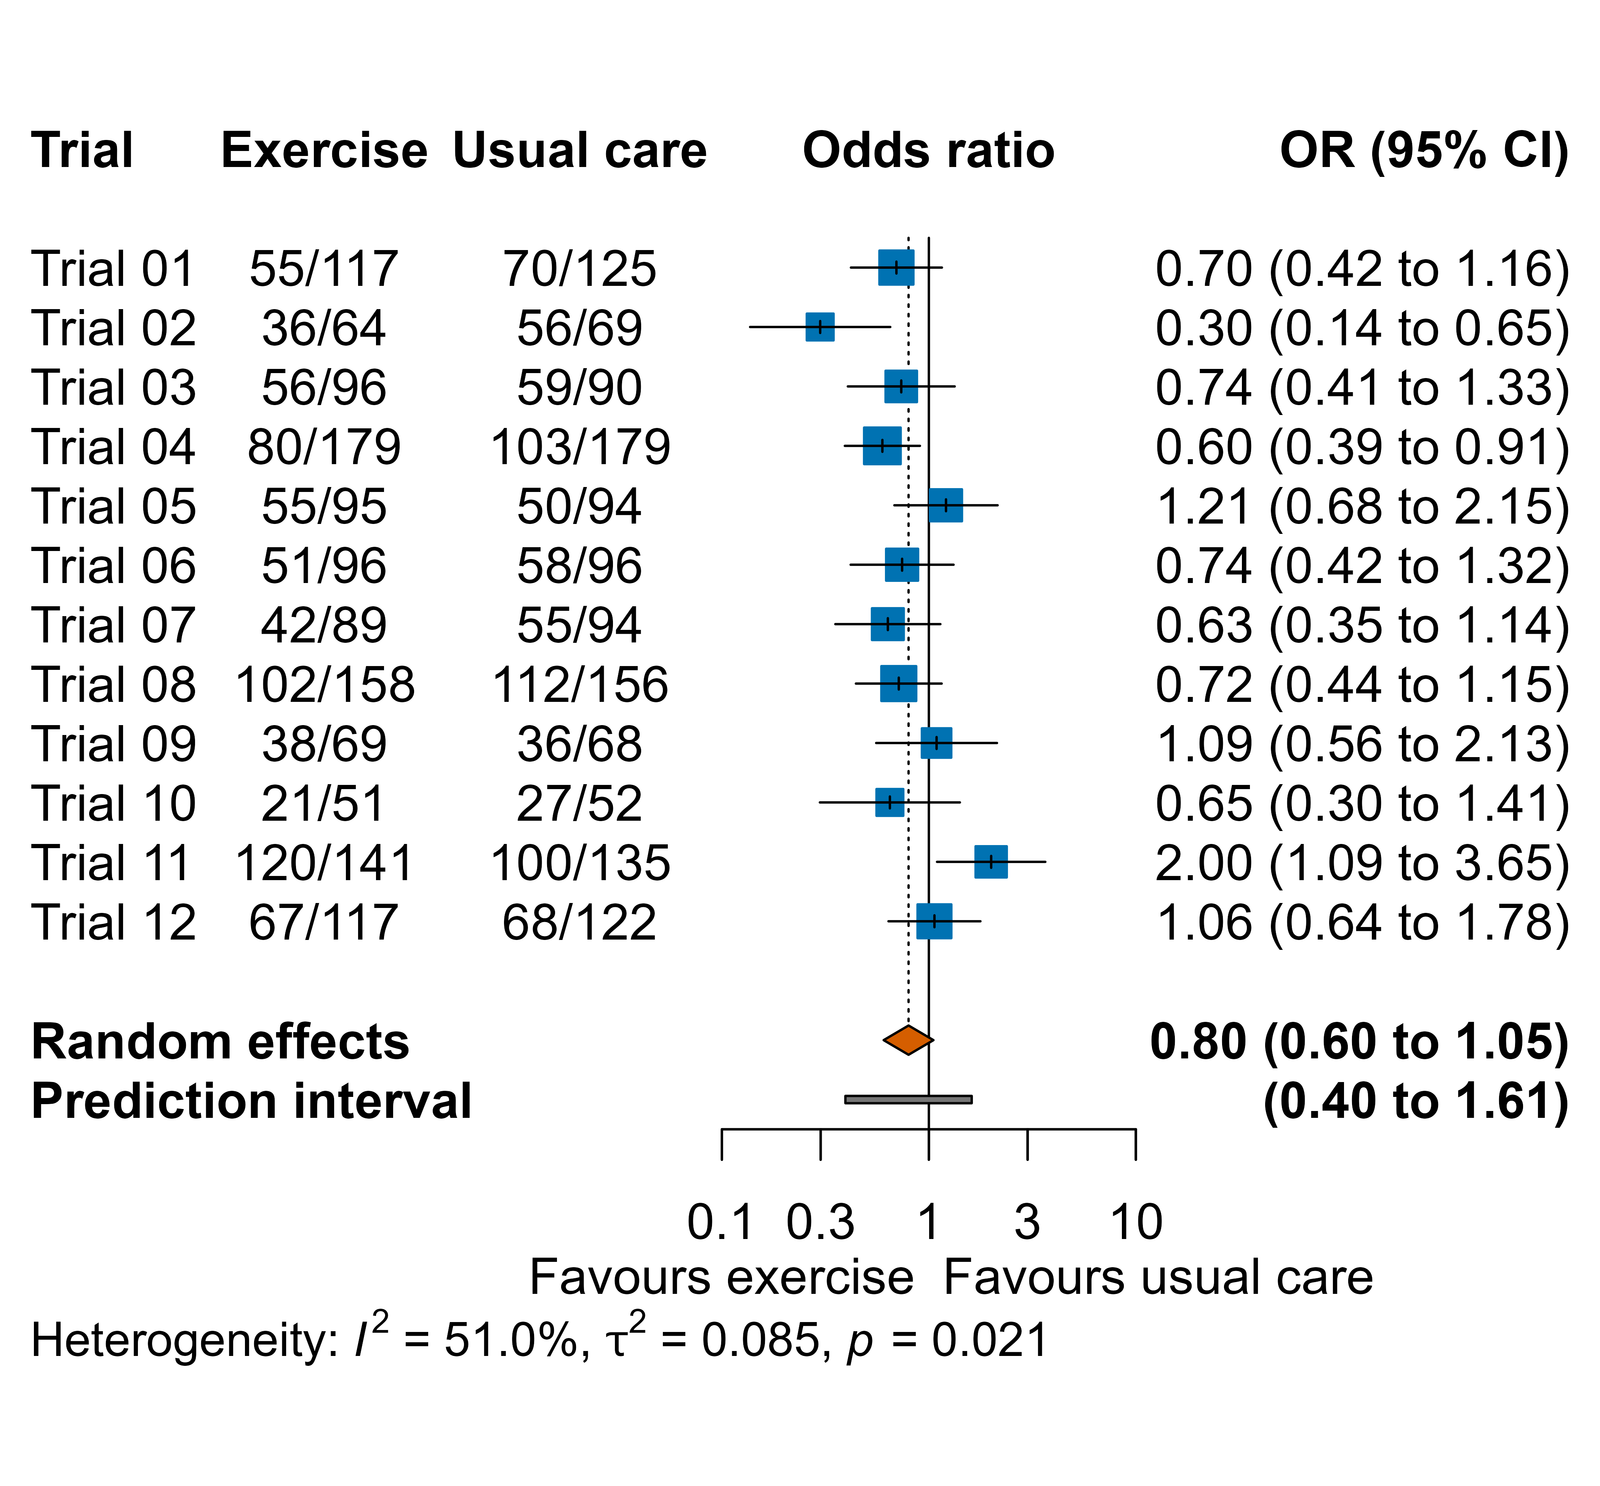
How to read it: each square is one trial's odds ratio, sized by its weight, with its 95% CI as a line. The diamond is the pooled odds ratio, 0.80 (95% CI 0.60 to 1.05): the average effect across these trials. The grey bar is the prediction interval, 0.40 to 1.61: where the effect in a new trial like these could lie. It is wider than the confidence interval because it also carries the between-trial variance, τ².วิธีอ่าน: สี่เหลี่ยมแต่ละอันคือ odds ratio ของหนึ่งการทดลอง ขนาดตามน้ำหนัก (weight) และเส้นคือช่วงความเชื่อมั่น 95% รูปข้าวหลามตัดคือ odds ratio รวม 0.80 (ช่วงความเชื่อมั่น 95% 0.60 ถึง 1.05) ซึ่งเป็นผลเฉลี่ยของการทดลองกลุ่มนี้ แถบสีเทาคือ prediction interval 0.40 ถึง 1.61 ซึ่งเป็นช่วงที่ผลของการทดลองใหม่ที่มีลักษณะคล้ายกันอาจตกอยู่ ช่วงนี้กว้างกว่าช่วงความเชื่อมั่นเพราะนำความแปรปรวนระหว่างการทดลอง (τ²) มารวมไว้ด้วย
Heterogeneity: τ² = 0.085, I² = 51.0% (95% CI 5.2% to 74.7%, a test-based interval from Q), and Cochran's Q = 22.44 on 11 degrees of freedom (P = 0.021). I² is the share of the variation between trial results that reflects real differences rather than chance; with this number of trials its interval is wide.ความแตกต่างระหว่างการทดลอง (heterogeneity): τ² = 0.085, I² = 51.0% (ช่วงความเชื่อมั่น 95% 5.2% ถึง 74.7% แบบ test-based ที่คำนวณจากค่า Q) และ Cochran's Q = 22.44 ที่องศาอิสระ 11 (P = 0.021) I² คือสัดส่วนของความผันแปรของผลระหว่างการทดลองที่มาจากความแตกต่างจริง ไม่ใช่จากความบังเอิญ เมื่อมีการทดลองเพียงเท่านี้ ช่วงความเชื่อมั่นของ I² จึงกว้าง
| Programme delivery | Trials | Participants | OR (95% CI) | I² | τ² |
|---|---|---|---|---|---|
| Supervised classes | 7 | 1,483 | 0.68 (0.49 to 0.94) | 31.4% | 0.014 |
| Home-based programme | 5 | 1,069 | 1.02 (0.59 to 1.76) | 51.7% | 0.097 |
| All trials | 12 | 2,552 | 0.80 (0.60 to 1.05) | 51.0% | 0.085 |
- OR, odds ratio of still being in pain, exercise against usual care; an odds ratio below 1 favours exercise. Each subgroup has its own τ² (REML) and a Hartung-Knapp 95% CI.OR คือ odds ratio ของการยังมีอาการปวด เปรียบเทียบกลุ่มออกกำลังกายกับกลุ่มการดูแลตามปกติ ค่าที่น้อยกว่า 1 แสดงว่าผลเอื้อต่อการออกกำลังกาย แต่ละกลุ่มย่อยมี τ² ของตนเอง (REML) และช่วงความเชื่อมั่น 95% แบบ Hartung-Knapp
- Test for subgroup differences (random effects with a separate τ² per subgroup; chi-square test of the between-subgroup Q, computed from the Hartung-Knapp standard errors of the subgroup estimates): Q = 2.97 on 1 degree of freedom, P = 0.085.การทดสอบความแตกต่างระหว่างกลุ่มย่อย (random effects โดยแต่ละกลุ่มย่อยมี τ² ของตนเอง ทดสอบค่า Q ระหว่างกลุ่มย่อยด้วยการแจกแจงไคกำลังสอง โดยใช้ standard error แบบ Hartung-Knapp ของค่าประมาณแต่ละกลุ่มย่อย): Q = 2.97 ที่องศาอิสระ 1, P = 0.085
How to read it: the pooled odds ratio is 0.68 (95% CI 0.49 to 0.94) in the 7 trials of supervised classes and 1.02 (95% CI 0.59 to 1.76) in the 5 trials of a home-based programme. Whether the subgroups differ is judged by the test for subgroup differences (P = 0.085), not by whether one interval crosses the line of no effect and the other does not.วิธีอ่าน: odds ratio รวมเท่ากับ 0.68 (ช่วงความเชื่อมั่น 95% 0.49 ถึง 0.94) ในการทดลองแบบชั้นเรียนที่มีผู้ดูแล 7 การทดลอง และ 1.02 (ช่วงความเชื่อมั่น 95% 0.59 ถึง 1.76) ในการทดลองแบบโปรแกรมที่บ้าน 5 การทดลอง การตัดสินว่ากลุ่มย่อยแตกต่างกันหรือไม่ ให้ดูจากการทดสอบความแตกต่างระหว่างกลุ่มย่อย (P = 0.085) ไม่ใช่ดูว่าช่วงความเชื่อมั่นของกลุ่มหนึ่งคร่อมเส้นไม่มีผลแต่อีกกลุ่มไม่คร่อม
Caution on subgroups: with 7 and 5 trials, the test for subgroup differences has low power, so a non-significant result does not show that the effect is the same in both subgroups. Programme delivery is a trial-level characteristic: trials that deliver exercise differently may also differ in patients and settings, so this comparison is observational, not randomised. Subgroups should be few and planned in the protocol.ข้อควรระวังเรื่องกลุ่มย่อย: เมื่อมีการทดลองเพียง 7 และ 5 การทดลอง การทดสอบความแตกต่างระหว่างกลุ่มย่อยมีอำนาจการทดสอบ (power) ต่ำ ผลที่ไม่มีนัยสำคัญจึงไม่ได้แสดงว่าผลในสองกลุ่มย่อยเท่ากัน รูปแบบการจัดโปรแกรมเป็นลักษณะระดับการทดลอง การทดลองที่จัดโปรแกรมต่างกันอาจต่างกันในด้านผู้ป่วยและสถานที่ด้วย การเปรียบเทียบนี้จึงเป็นการเปรียบเทียบเชิงสังเกต ไม่ใช่การเปรียบเทียบที่ได้จากการสุ่ม กลุ่มย่อยควรมีจำนวนน้อยและกำหนดไว้ล่วงหน้าในโครงร่างการวิจัย (protocol)
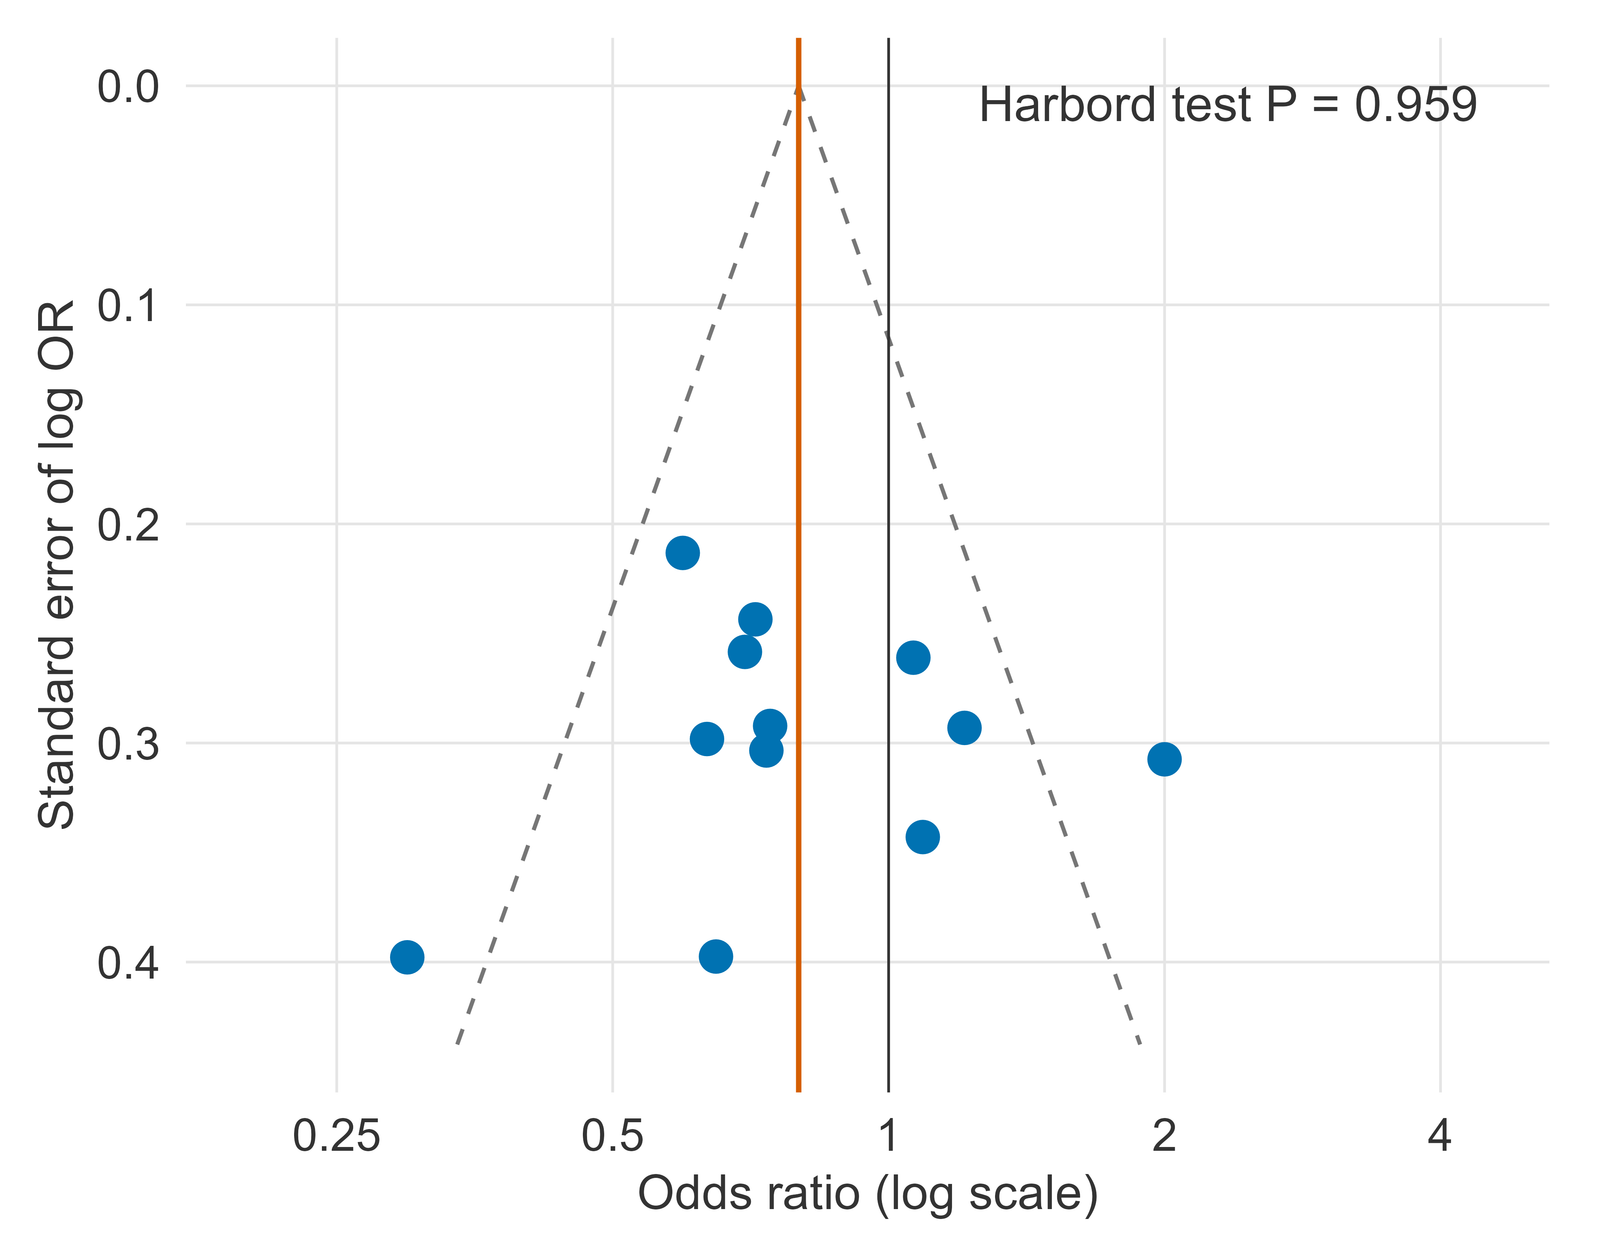
How to read it: without small-study effects, trials scatter evenly on both sides of the pooled line, and small trials (larger standard error, lower in the plot) spread wider. Tests for funnel-plot asymmetry are unreliable with fewer than about 10 trials, so the plan runs one only when there are at least that many. This review has 12, so Harbord's test, which suits odds ratios better than Egger's test, was run: P = 0.959. With this few trials and heterogeneity present the test has little power, so a non-significant result does not rule out small-study effects or publication bias; asymmetry, when present, can also come from heterogeneity or chance.วิธีอ่าน: หากไม่มี small-study effects การทดลองจะกระจายสมดุลทั้งสองข้างของเส้นค่าประมาณรวม และการทดลองขนาดเล็ก (ค่าความคลาดเคลื่อนมาตรฐานมาก อยู่ต่ำลงในรูป) จะกระจายกว้างกว่า การทดสอบความไม่สมมาตรของ funnel plot ไม่น่าเชื่อถือเมื่อมีการทดลองน้อยกว่าประมาณ 10 การทดลอง แผนการวิเคราะห์จึงกำหนดให้ทดสอบเฉพาะเมื่อมีการทดลองไม่น้อยกว่าจำนวนดังกล่าว การทบทวนนี้มี 12 การทดลอง จึงทดสอบด้วยวิธีของ Harbord ซึ่งเหมาะกับ odds ratio มากกว่าวิธีของ Egger ได้ค่า P = 0.959 เมื่อมีการทดลองไม่มากและมีความแตกต่างระหว่างการทดลอง การทดสอบนี้มีอำนาจต่ำ ผลที่ไม่มีนัยสำคัญจึงไม่ได้ตัดความเป็นไปได้ของ small-study effects หรือ publication bias และความไม่สมมาตร หากพบ ก็อาจเกิดจากความแตกต่างระหว่างการทดลองหรือความบังเอิญได้เช่นกัน
Part B: network meta-analysisส่วน B: การวิเคราะห์อภิมานแบบเครือข่าย (network meta-analysis)
Methods note. A network meta-analysis compares several treatments at once by combining direct evidence (trials that compared two treatments head to head) with indirect evidence (comparisons made through a shared comparator). The 14 trials, 2 of them with three arms, were analysed with the frequentist graph-theoretical method in a random-effects model with one between-trial variance for all comparisons (REML), with usual care as the reference. A three-arm trial enters with all of its pairwise comparisons, and the model accounts for their correlation. Effects are odds ratios of still being in pain. The 95% CIs of the network estimates use the normal (Wald) approximation; unlike Part A, no Hartung-Knapp adjustment is applied, so these intervals may be too narrow when trials are few. All analyses used open-source statistical software; the delivered report names the software and its versions.บันทึกวิธีการ การวิเคราะห์อภิมานแบบเครือข่ายเปรียบเทียบการรักษาหลายทางเลือกพร้อมกัน โดยรวมหลักฐานทางตรง (การทดลองที่เปรียบเทียบสองการรักษากันโดยตรง) เข้ากับหลักฐานทางอ้อม (การเปรียบเทียบผ่านกลุ่มเปรียบเทียบร่วม) การทดลอง 14 การทดลอง ซึ่งมี 2 การทดลองที่มีสามกลุ่ม วิเคราะห์ด้วยวิธี frequentist แบบ graph-theoretical ในโมเดล random effects ที่ใช้ความแปรปรวนระหว่างการทดลองค่าเดียวร่วมกันทุกคู่เปรียบเทียบ (REML) และใช้การดูแลตามปกติเป็นกลุ่มอ้างอิง การทดลองสามกลุ่มเข้าสู่การวิเคราะห์ด้วยคู่เปรียบเทียบทุกคู่ภายในการทดลอง และโมเดลคำนึงถึงความสัมพันธ์ระหว่างคู่เหล่านั้น ผลแสดงเป็น odds ratio ของการยังมีอาการปวด ช่วงความเชื่อมั่น 95% ของค่าประมาณจากเครือข่ายคำนวณด้วยการประมาณแบบปกติ (Wald) ต่างจากส่วน A ที่ใช้วิธี Hartung-Knapp ช่วงเหล่านี้จึงอาจแคบเกินไปเมื่อมีการทดลองไม่มาก การวิเคราะห์ทั้งหมดใช้โปรแกรมสถิติแบบโอเพนซอร์ส และรายงานที่ส่งมอบจะระบุชื่อโปรแกรมพร้อมเวอร์ชัน
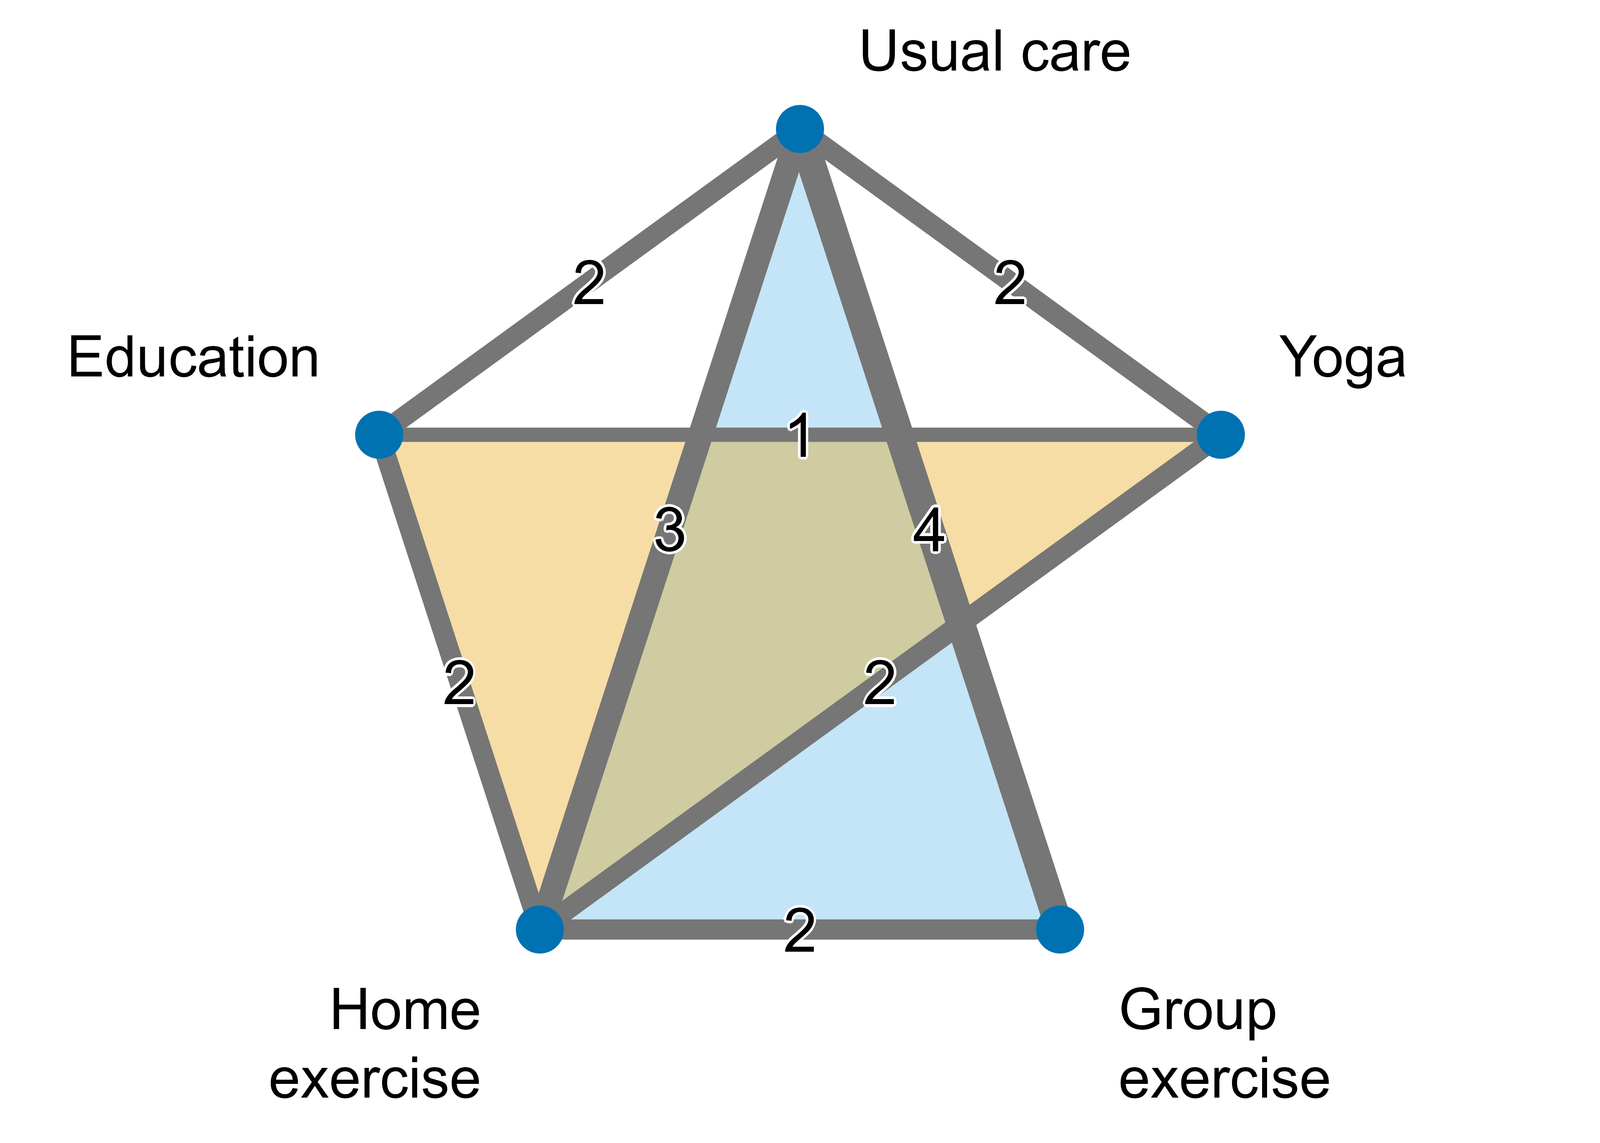
How to read it: 8 of the 10 possible pairs were compared directly. Education against group exercise and group exercise against yoga have no line: no trial compared them, so the network estimates them only through the other treatments. The number on each line shows how much direct evidence a comparison has; thin parts of the network give less precise estimates.วิธีอ่าน: จากคู่ที่เป็นไปได้ทั้งหมด 10 คู่ มี 8 คู่ที่ถูกเปรียบเทียบโดยตรง คู่การให้ความรู้กับการออกกำลังกายเป็นกลุ่ม และคู่การออกกำลังกายเป็นกลุ่มกับโยคะไม่มีเส้นเชื่อม เพราะไม่มีการทดลองใดเปรียบเทียบโดยตรง เครือข่ายจึงประมาณผลของคู่เหล่านี้ผ่านการรักษาอื่นเท่านั้น ตัวเลขบนเส้นบอกปริมาณหลักฐานทางตรงของแต่ละคู่ ส่วนของเครือข่ายที่มีหลักฐานน้อยจะให้ค่าประมาณที่แม่นยำน้อยกว่า
| Row vs column | Usual care | Education | Home exercise | Group exercise |
|---|---|---|---|---|
| Education | 1.08 (0.75 to 1.56) | |||
| Home exercise | 0.75 (0.55 to 1.02) | 0.69 (0.47 to 1.01) | ||
| Group exercise | 0.44 (0.32 to 0.62) | 0.41 (0.26 to 0.65) | 0.59 (0.41 to 0.86) | |
| Yoga | 0.80 (0.55 to 1.16) | 0.74 (0.47 to 1.16) | 1.07 (0.71 to 1.60) | 1.80 (1.12 to 2.89) |
- An odds ratio below 1 means fewer participants still in pain on the row treatment than on the column treatment. Every estimate combines the direct and indirect evidence available for that pair; each 95% CI uses the normal (Wald) approximation.odds ratio น้อยกว่า 1 หมายถึงผู้ที่ได้รับการรักษาในแถวยังมีอาการปวดน้อยกว่าผู้ที่ได้รับการรักษาในคอลัมน์ ค่าประมาณทุกค่ารวมหลักฐานทางตรงและทางอ้อมเท่าที่มีของคู่นั้น และช่วงความเชื่อมั่น 95% ทุกช่วงคำนวณด้วยการประมาณแบบปกติ (Wald)
- All comparisons share one between-trial variance: τ² = 0.038, I² = 26.2%.ทุกคู่เปรียบเทียบใช้ความแปรปรวนระหว่างการทดลองค่าเดียวกัน: τ² = 0.038, I² = 26.2%
How to read it: find the row treatment, then the column treatment. Group exercise against usual care, a pair with direct trials, has an odds ratio of 0.44 (95% CI 0.32 to 0.62). Group exercise against education was never compared in a trial; its odds ratio, 0.41 (95% CI 0.26 to 0.65), comes only from indirect evidence and holds only if the transitivity assumption holds.วิธีอ่าน: หาการรักษาในแถวก่อน แล้วจึงหาการรักษาในคอลัมน์ ตัวอย่างเช่น การออกกำลังกายเป็นกลุ่มเทียบกับการดูแลตามปกติ ซึ่งมีการทดลองเปรียบเทียบโดยตรง มี odds ratio 0.44 (ช่วงความเชื่อมั่น 95% 0.32 ถึง 0.62) ส่วนการออกกำลังกายเป็นกลุ่มเทียบกับการให้ความรู้ไม่เคยถูกเปรียบเทียบในการทดลองใดเลย odds ratio 0.41 (ช่วงความเชื่อมั่น 95% 0.26 ถึง 0.65) จึงมาจากหลักฐานทางอ้อมเท่านั้น และเชื่อถือได้ก็ต่อเมื่อสมมติฐาน transitivity เป็นจริง
| Treatment | Rank | P-score | OR vs usual care (95% CI) |
|---|---|---|---|
| Group exercise | 1 | 0.997 | 0.44 (0.32 to 0.62) |
| Home exercise | 2 | 0.641 | 0.75 (0.55 to 1.02) |
| Yoga | 3 | 0.542 | 0.80 (0.55 to 1.16) |
| Usual care | 4 | 0.204 | Reference |
| Education | 5 | 0.115 | 1.08 (0.75 to 1.56) |
- P-score: the mean certainty, on a scale from zero to one, that a treatment is better than the other treatments (here, fewer participants still in pain), computed from the network estimates and their standard errors.P-score คือความแน่นอนเฉลี่ยว่าการรักษาหนึ่งดีกว่าการรักษาอื่น (ในที่นี้คือมีผู้ที่ยังปวดน้อยกว่า) มีค่าตั้งแต่ศูนย์ถึงหนึ่ง คำนวณจากค่าประมาณของเครือข่ายและค่าความคลาดเคลื่อนมาตรฐาน
- OR, odds ratio against usual care with its 95% CI (normal approximation); an odds ratio below 1 favours the treatment in that row.OR คือ odds ratio เทียบกับการดูแลตามปกติ พร้อมช่วงความเชื่อมั่น 95% (การประมาณแบบปกติ) ค่าที่น้อยกว่า 1 แสดงว่าผลเอื้อต่อการรักษาในแถวนั้น
Ranks are uncertain and are not effect sizes. The treatment ranked first has a P-score of 0.997, but a P-score says how sure the network is about the order, not how large the benefit is: read the odds ratios beside it. The treatments in second and third place have P-scores of 0.641 and 0.542, yet the odds ratio between them is 0.94 (95% CI 0.63 to 1.40), an interval that includes 1 and is wide in both directions: the data do not clearly separate these two, even though the table lists them in order.อันดับมีความไม่แน่นอน และไม่ใช่ขนาดผล ทางเลือกอันดับหนึ่งมี P-score 0.997 แต่ P-score บอกเพียงว่าเครือข่ายมั่นใจในลำดับมากเพียงใด ไม่ได้บอกว่าประโยชน์มากเท่าใด จึงต้องอ่านคู่กับ odds ratio ที่อยู่ข้างกัน ทางเลือกอันดับสองและสามมี P-score 0.641 และ 0.542 แต่ odds ratio ระหว่างสองทางเลือกนี้เท่ากับ 0.94 (ช่วงความเชื่อมั่น 95% 0.63 ถึง 1.40) ช่วงนี้ครอบคลุมค่า 1 และกว้างทั้งสองทิศทาง ข้อมูลจึงยังแยกสองทางเลือกนี้ออกจากกันได้ไม่ชัดเจน แม้ตารางจะเรียงไว้เป็นลำดับก็ตาม
| Comparison | Direct trials | Direct OR (95% CI) | Indirect OR (95% CI) | P value |
|---|---|---|---|---|
| Education vs Usual care | 2 | 1.05 (0.64 to 1.72) | 1.12 (0.65 to 1.96) | 0.858 |
| Home exercise vs Usual care | 3 | 0.69 (0.45 to 1.07) | 0.81 (0.52 to 1.27) | 0.625 |
| Home exercise vs Education | 2 | 0.68 (0.41 to 1.13) | 0.71 (0.39 to 1.27) | 0.918 |
| Group exercise vs Usual care | 4 | 0.46 (0.32 to 0.65) | 0.40 (0.18 to 0.85) | 0.743 |
| Group exercise vs Home exercise | 2 | 0.44 (0.27 to 0.74) | 0.85 (0.48 to 1.49) | 0.096 |
| Yoga vs Usual care | 2 | 0.74 (0.45 to 1.22) | 0.88 (0.49 to 1.59) | 0.657 |
| Yoga vs Education | 1 | 0.72 (0.35 to 1.47) | 0.75 (0.42 to 1.35) | 0.918 |
| Yoga vs Home exercise | 2 | 1.16 (0.67 to 2.01) | 0.96 (0.53 to 1.75) | 0.646 |
- Direct, the estimate from trials that compared the pair head to head; indirect, the estimate from the rest of the network. The odds ratio is the first-named treatment against the second, the same way round as row against column in the league table. The P value tests whether the direct and indirect estimates differ (random effects).Direct คือค่าประมาณจากการทดลองที่เปรียบเทียบคู่นั้นโดยตรง ส่วน Indirect คือค่าประมาณจากส่วนที่เหลือของเครือข่าย odds ratio คือการรักษาที่ระบุก่อนเทียบกับการรักษาที่ระบุหลัง ในทิศเดียวกับการอ่านแถวเทียบคอลัมน์ในตารางเปรียบเทียบทุกคู่ ค่า P ทดสอบว่าค่าประมาณทางตรงและทางอ้อมแตกต่างกันหรือไม่ (random effects)
- Design-by-treatment interaction test for the whole network (random effects): Q = 11.68 on 7 degrees of freedom, P = 0.112.การทดสอบ design-by-treatment interaction ของทั้งเครือข่าย (random effects): Q = 11.68 ที่องศาอิสระ 7, P = 0.112
How to read it: when the direct and indirect estimates of a comparison agree, there is no sign of inconsistency for that comparison. Here the smallest P value among the 8 comparisons is 0.096, and the design-by-treatment test for the whole network gives P = 0.112. These data were simulated without inconsistency, so this result is expected. The 8 tests are not independent and have low power when each comparison rests on few trials, so finding no inconsistency is not proof of consistency.วิธีอ่าน: เมื่อค่าประมาณทางตรงและทางอ้อมของคู่ใดสอดคล้องกัน แสดงว่าไม่พบสัญญาณของความไม่สอดคล้องในคู่นั้น ในตัวอย่างนี้ ค่า P ที่น้อยที่สุดในคู่เปรียบเทียบ 8 คู่เท่ากับ 0.096 และการทดสอบ design-by-treatment ของทั้งเครือข่ายได้ P = 0.112 ข้อมูลชุดนี้จำลองให้ไม่มีความไม่สอดคล้อง ผลนี้จึงเป็นไปตามที่คาด การทดสอบทั้ง 8 คู่ไม่เป็นอิสระต่อกัน และมีอำนาจต่ำเมื่อแต่ละคู่มีการทดลองไม่มาก การไม่พบความไม่สอดคล้องจึงไม่ได้พิสูจน์ว่าเครือข่ายสอดคล้องกันจริง
Limits of this kind of analysisข้อจำกัดของการวิเคราะห์ลักษณะนี้
The results are only as good as the included trials. In a real job the review team assesses each trial's risk of bias and the certainty of the evidence. The statistician does not select studies or extract data alone: the analysis starts from data the team has screened and extracted, ideally checked by two reviewers.ผลการวิเคราะห์จะน่าเชื่อถือได้ไม่เกินคุณภาพของการทดลองที่นำมารวม ในงานจริง ทีมทบทวนวรรณกรรมเป็นผู้ประเมินความเสี่ยงต่ออคติ (risk of bias) ของแต่ละการทดลองและความเชื่อมั่นของหลักฐาน นักสถิติไม่ได้คัดเลือกการศึกษาหรือสกัดข้อมูลเพียงลำพัง การวิเคราะห์เริ่มจากข้อมูลที่ทีมคัดกรองและสกัดแล้ว ซึ่งควรผ่านการตรวจโดยผู้ทบทวนสองคน
Transitivity, the assumption behind every indirect comparison, means the trials are similar enough in patients, settings and the way treatments were delivered that comparing two treatments through a shared comparator is fair. No statistical test can prove it; the clinical team must judge it before the network is analysed.Transitivity เป็นสมมติฐานเบื้องหลังการเปรียบเทียบทางอ้อมทุกคู่ หมายความว่าการทดลองต่าง ๆ มีความคล้ายกันมากพอทั้งในด้านผู้ป่วย สถานที่ และวิธีให้การรักษา จนการเปรียบเทียบสองการรักษาผ่านกลุ่มเปรียบเทียบร่วมเป็นการเปรียบเทียบที่เป็นธรรม ไม่มีการทดสอบทางสถิติใดพิสูจน์สมมติฐานนี้ได้ ทีมผู้เชี่ยวชาญทางคลินิกต้องเป็นผู้พิจารณาก่อนวิเคราะห์เครือข่าย
This page gives no clinical conclusion or recommendation. What the pooled estimates mean for patients, and whether any option should be offered, is for the review team to interpret.หน้านี้ไม่ได้ให้ข้อสรุปหรือคำแนะนำทางคลินิก ความหมายของค่าประมาณรวมต่อผู้ป่วย และการตัดสินว่าควรเลือกทางเลือกใด เป็นหน้าที่ของทีมทบทวนวรรณกรรมในการแปลผล
What you send and do yourselfสิ่งที่คุณต้องส่งและทำเอง
- The extracted study-level data, with the source of every number.ข้อมูลระดับการศึกษาที่สกัดแล้ว พร้อมแหล่งที่มาของตัวเลขทุกตัว
- The risk-of-bias assessments your team has made.ผลการประเมินความเสี่ยงของอคติที่ทีมของคุณทำไว้
- You interpret the results and write your own article, and acknowledge the statistical help in the way your journal asks.คุณเป็นผู้แปลผลและเขียนบทความของคุณเอง และระบุความช่วยเหลือด้านสถิติตามรูปแบบที่วารสารกำหนด
Limitsขอบเขตและข้อจำกัด
- Statistical analysis and advice only: the research question, the data, the interpretation and the writing stay yours.บริการนี้เป็นงานวิเคราะห์และให้คำแนะนำทางสถิติเท่านั้น คำถามวิจัย ข้อมูล การแปลผล และการเขียน เป็นของคุณทั้งหมด
- Offered as a special case: every request is reviewed before it is accepted.รับเป็นกรณีพิเศษ ทุกคำขอต้องผ่านการพิจารณาก่อนรับงาน
- The literature search, the screening, the data extraction and the risk-of-bias assessment are not included.ไม่รวมการสืบค้นวรรณกรรม การคัดกรอง การสกัดข้อมูล และการประเมินความเสี่ยงของอคติ
- Not for a thesis, an independent study or other work submitted for a degree; for those, I offer consultation only.ไม่รับทำงานที่จะนำไปใช้เพื่อสำเร็จการศึกษา เช่น วิทยานิพนธ์ การค้นคว้าอิสระ หรือผลงานอื่นที่ยื่นเพื่อรับปริญญา งานลักษณะนี้รับเฉพาะการให้คำปรึกษา
- Authorship is not sold and is not a condition of the service.การมีชื่อเป็นผู้นิพนธ์ไม่ใช่สิ่งที่ซื้อขายได้ และไม่ใช่เงื่อนไขในการรับงาน
Request this serviceขอใช้บริการนี้
Every request is reviewed first. I may accept or decline it. The timeline is agreed per project after review.ผมพิจารณาคำขอทุกงานก่อน และอาจรับหรือปฏิเสธงาน ระยะเวลาของแต่ละงานตกลงกันหลังพิจารณาคำขอแล้ว
Member prices apply only to orders that start on uniqcret.com; if you found me on Fastwork or your enquiry began there, please order on Fastwork at the Fastwork price.ราคาสมาชิกใช้กับงานที่เริ่มต้นบน uniqcret.com เท่านั้น หากคุณรู้จักผมจาก Fastwork หรือเริ่มสอบถามบน Fastwork กรุณาสั่งงานบน Fastwork ในราคาของ Fastwork