Statistical sections for ethics submissionsส่วนสถิติในเอกสารขอรับรองจริยธรรมการวิจัย
Ethics-committee submission: the statistical and data-handling sections, and the answers to the committeeเอกสารยื่นคณะกรรมการจริยธรรมการวิจัย: ส่วนสถิติและการจัดการข้อมูล และการตอบข้อเสนอแนะของคณะกรรมการ
An invented company plans a low-risk study among its office staff: a two-arm randomised comparison of a wrist-worn step counter that sends weekly feedback messages against the same step counter without messages, over 12 weeks. Before the study goes to an ethics committee, the research team asks a statistician for the sections the committee reviews on statistics and data (the sample-size justification, the statistical analysis and the data handling) and later for answers to the committee's comments on them. The company, the staff, the pilot study, the committee and its comments are all invented, and the pilot data are simulated with a fixed seed.บริษัทสมมติแห่งหนึ่งวางแผนทำการศึกษาที่มีความเสี่ยงต่ำในพนักงานสำนักงาน เป็นการทดลองแบบสุ่มสองกลุ่ม เปรียบเทียบเครื่องนับก้าวแบบสวมข้อมือที่ส่งข้อความป้อนกลับทุกสัปดาห์ กับเครื่องนับก้าวแบบเดียวกันที่ไม่มีข้อความ ติดตามนาน 12 สัปดาห์ ก่อนยื่นโครงการต่อคณะกรรมการจริยธรรมการวิจัย คณะผู้วิจัยขอให้นักสถิติเขียนส่วนที่คณะกรรมการพิจารณาด้านสถิติและข้อมูล ได้แก่ การคำนวณขนาดตัวอย่าง การวิเคราะห์ทางสถิติ และการจัดการข้อมูล และภายหลังขอให้ช่วยตอบข้อเสนอแนะของคณะกรรมการในส่วนเหล่านี้ บริษัท พนักงาน การศึกษานำร่อง คณะกรรมการ และข้อเสนอแนะทั้งหมดเป็นเรื่องสมมติ ส่วนข้อมูลการศึกษานำร่องเป็นข้อมูลจำลองที่สร้างด้วยค่า seed คงที่
What you receiveสิ่งที่คุณจะได้รับ
The sample-size, analysis and data-handling sections of an ethics-committee submission, and statistical answers to the committee's comments.จัดทำส่วนขนาดตัวอย่าง การวิเคราะห์ข้อมูล และการจัดการข้อมูล ในเอกสารที่ยื่นต่อคณะกรรมการจริยธรรมการวิจัย และเตรียมคำตอบเชิงสถิติต่อความเห็นของคณะกรรมการ
- The sample-size section, with its assumptions.ส่วนการคำนวณขนาดตัวอย่าง พร้อมสมมติฐานที่ใช้
- The statistical-analysis section.ส่วนการวิเคราะห์ทางสถิติ
- The data-handling section: de-identification, storage and who may access the data.ส่วนการจัดการข้อมูล ได้แก่ การตัดข้อมูลระบุตัวตน การจัดเก็บ และผู้มีสิทธิ์เข้าถึงข้อมูล
- A table answering the committee's statistical comments, if there are any.ตารางตอบความเห็นด้านสถิติของคณะกรรมการ ถ้ามี
The sampleตัวอย่างงาน
Sample work on simulated data. No real patient, no client project.ตัวอย่างงานจากข้อมูลจำลองทั้งหมด ไม่ใช่ข้อมูลผู้ป่วยจริง และไม่ใช่งานของลูกค้ารายใด
What this sample containsสิ่งที่อยู่ในตัวอย่างนี้
- A sample-size justification: each assumption with its source, the method, the result with a dropout allowance (Table 1), and a power curve that shows what happens if the true difference is smaller than assumed (Figure 1).การคำนวณขนาดตัวอย่างพร้อมเหตุผลประกอบ ได้แก่ ข้อสมมติแต่ละข้อพร้อมที่มา วิธีคำนวณ และผลการคำนวณที่เผื่ออัตราการถอนตัวแล้ว (ตาราง 1) และกราฟ power ที่แสดงว่าจะเกิดอะไรขึ้นหากผลต่างที่แท้จริงเล็กกว่าที่สมมติไว้ (รูป 1)
- A statistical analysis section in the short form committees ask for: analysis population, primary and secondary analyses, missing data, significance level and software, with a one-table summary (Table 2).ส่วนการวิเคราะห์ทางสถิติแบบกระชับตามที่คณะกรรมการมักขอ ได้แก่ ประชากรที่ใช้วิเคราะห์ การวิเคราะห์หลักและการวิเคราะห์รอง การจัดการข้อมูลที่ขาดหาย ระดับนัยสำคัญ และซอฟต์แวร์ พร้อมตารางสรุปหนึ่งตาราง (ตาราง 2)
- A data-handling section limited to what a statistician specifies: the de-identified analysis data set, study codes, who holds the linking key, access, storage, retention and destruction, with a table of who holds each file (Table 3).ส่วนการจัดการข้อมูลเฉพาะเรื่องที่นักสถิติกำหนด ได้แก่ ชุดข้อมูลสำหรับวิเคราะห์ที่ถอดข้อมูลระบุตัวตนออกแล้ว รหัสการศึกษา ผู้ถือรายการเชื่อมโยงรหัส การเข้าถึง การจัดเก็บ ระยะเวลาการเก็บรักษา และการทำลายข้อมูล พร้อมตารางระบุผู้เก็บรักษาไฟล์แต่ละไฟล์ (ตาราง 3)
- Answers to the committee's comments on these sections, each with the change made in the document.คำตอบต่อข้อเสนอแนะของคณะกรรมการในส่วนเหล่านี้ แต่ละข้อระบุสิ่งที่แก้ไขในเอกสาร
These are the statistical and data-handling sections only. The research team writes the protocol, the participant information and consent documents and the rest of the submission, and the committee's own forms and rules prevail over the headings used here.ตัวอย่างนี้เป็นเฉพาะส่วนสถิติและการจัดการข้อมูลเท่านั้น คณะผู้วิจัยเป็นผู้เขียนโครงร่างการวิจัย เอกสารชี้แจงข้อมูลแก่ผู้เข้าร่วมการวิจัยและหนังสือแสดงเจตนายินยอม รวมถึงส่วนอื่นทั้งหมดของเอกสารยื่น ทั้งนี้ ให้ยึดแบบฟอร์มและระเบียบของคณะกรรมการเป็นหลัก มากกว่าหัวข้อที่ใช้ในตัวอย่างนี้
Sample size justificationการคำนวณขนาดตัวอย่างและเหตุผลประกอบ
The sample size is based on the primary outcome, the mean daily step count in the final week of follow-up, compared between the two arms with a two-sample t-test at a two-sided significance level of 0.05 and 80% power. The research team set the smallest difference worth detecting at 1,000 steps per day. The standard deviation comes from a pilot of 40 staff (2,365 steps per day); because a small pilot estimates it imprecisely, the calculation uses the upper limit of its one-sided 80% confidence interval, 2,634 steps per day. This gives 110 analysable staff per arm. Allowing for 15% dropout, 130 staff per arm will be enrolled, 260 in total.ขนาดตัวอย่างคำนวณจากผลลัพธ์หลัก คือค่าเฉลี่ยจำนวนก้าวต่อวันในสัปดาห์สุดท้ายของการติดตาม ซึ่งเปรียบเทียบระหว่างสองกลุ่มด้วย two-sample t-test ที่ระดับนัยสำคัญ 0.05 แบบสองทาง (two-sided) และอำนาจการทดสอบ (power) 80% คณะผู้วิจัยกำหนดผลต่างที่เล็กที่สุดที่ควรตรวจพบไว้ที่ 1,000 ก้าวต่อวัน ค่าส่วนเบี่ยงเบนมาตรฐาน (SD) ได้จากการศึกษานำร่องในพนักงาน 40 คน (2,365 ก้าวต่อวัน) เนื่องจากการศึกษานำร่องขนาดเล็กประมาณค่า SD ได้ไม่แม่นยำ การคำนวณจึงใช้ขีดจำกัดบนของช่วงความเชื่อมั่นด้านเดียว 80% ของ SD ซึ่งเท่ากับ 2,634 ก้าวต่อวัน จึงต้องมีผู้เข้าร่วมที่วิเคราะห์ได้กลุ่มละ 110 คน เมื่อเผื่ออัตราการถอนตัวหรือสูญหายจากการติดตาม 15% จะรับพนักงานเข้าร่วมการศึกษากลุ่มละ 130 คน รวมทั้งสิ้น 260 คน
The analysis will adjust for baseline steps, which is expected to add power. The sample size does not count on that gain, because the correlation between baseline steps and final-week steps 12 weeks later is not yet known; the pilot measured only two weeks a short time apart.การวิเคราะห์จะปรับค่าจำนวนก้าวก่อนเริ่มการศึกษา (baseline) ซึ่งคาดว่าจะช่วยเพิ่ม power แต่การคำนวณขนาดตัวอย่างไม่ได้นับรวมประโยชน์ส่วนนี้ เพราะยังไม่ทราบสหสัมพันธ์ระหว่างจำนวนก้าวก่อนเริ่มการศึกษากับจำนวนก้าวในสัปดาห์สุดท้ายเมื่อผ่านไป 12 สัปดาห์ การศึกษานำร่องวัดเพียงสองสัปดาห์ที่ห่างกันไม่นาน
| Item | Value | Source |
|---|---|---|
| Assumptions | ||
| Design | Two arms, equal size | Research team |
| Primary outcome | Mean daily steps, final week of follow-up | Measured by the step counter |
| Difference to detect | 1,000 steps per day | Smallest difference worth detecting, set by the research team |
| Pilot standard deviation | 2,365 steps per day | Pilot of 40 staff, first week |
| Standard deviation used | 2,634 steps per day | Upper limit of the one-sided 80% confidence interval of the pilot SD |
| Significance level | 0.05, two-sided | Research team |
| Power | 80% | Research team |
| Dropout allowance | 15% | Research team's expected loss to follow-up |
| Calculation method | Two-sample t-test | Calculation assumes an unadjusted comparison; the planned baseline-adjusted analysis (Table 2) is expected to add power |
| Result | ||
| Analysable staff per arm | 110 | Power 80.1% with this number |
| Enrolled per arm | 130 | 110 divided by (1 − 0.15), rounded up |
| Enrolled in total | 260 | Both arms |
- Analysable staff per arm come from a two-sample t-test with equal arms, with power computed from the noncentral t distribution counting both tails, rounded up to whole staff. Enrolment divides that number by one minus the dropout allowance and rounds up again. The standard deviation used is the pilot SD times the square root of d / q, where d is the pilot's degrees of freedom (39) and q is the lower 20% quantile of the chi-square distribution with d degrees of freedom.จำนวนที่วิเคราะห์ได้ต่อกลุ่มคำนวณจาก two-sample t-test ที่สองกลุ่มมีขนาดเท่ากัน โดยคำนวณ power จากการแจกแจง t แบบไม่ศูนย์กลาง (noncentral t distribution) ซึ่งนับทั้งสองหาง แล้วปัดขึ้นเป็นจำนวนคนเต็ม จำนวนที่รับเข้าคำนวณโดยนำจำนวนดังกล่าวหารด้วยหนึ่งลบสัดส่วนการถอนตัว แล้วปัดขึ้นอีกครั้ง ส่วน SD ที่ใช้คือ SD จากการศึกษานำร่องคูณด้วยรากที่สองของ d / q โดย d คือองศาอิสระของการศึกษานำร่อง (39) และ q คือควอนไทล์ล่าง 20% ของการแจกแจงไคสแควร์ที่มีองศาอิสระ d
- The pilot and every value from it are invented and simulated.การศึกษานำร่องและค่าทุกค่าที่ได้จากการศึกษานำร่องเป็นข้อมูลสมมติที่จำลองขึ้น
How to read Table 1: the upper rows are the assumptions, including the calculation method, each with its source, so the committee can see which number came from the research team, which from the pilot and which from the calculation. The lower rows are the result. If the research team changes an assumption, the statistician reruns the calculation and the result rows change with it.วิธีอ่านตาราง 1: แถวส่วนบนเป็นข้อสมมติ รวมถึงวิธีคำนวณ แต่ละแถวระบุที่มา คณะกรรมการจึงเห็นได้ว่าตัวเลขใดมาจากคณะผู้วิจัย ตัวเลขใดมาจากการศึกษานำร่อง และตัวเลขใดได้จากการคำนวณ แถวส่วนล่างเป็นผลการคำนวณ หากคณะผู้วิจัยเปลี่ยนข้อสมมติข้อใด นักสถิติจะคำนวณใหม่และแถวผลการคำนวณจะเปลี่ยนตาม
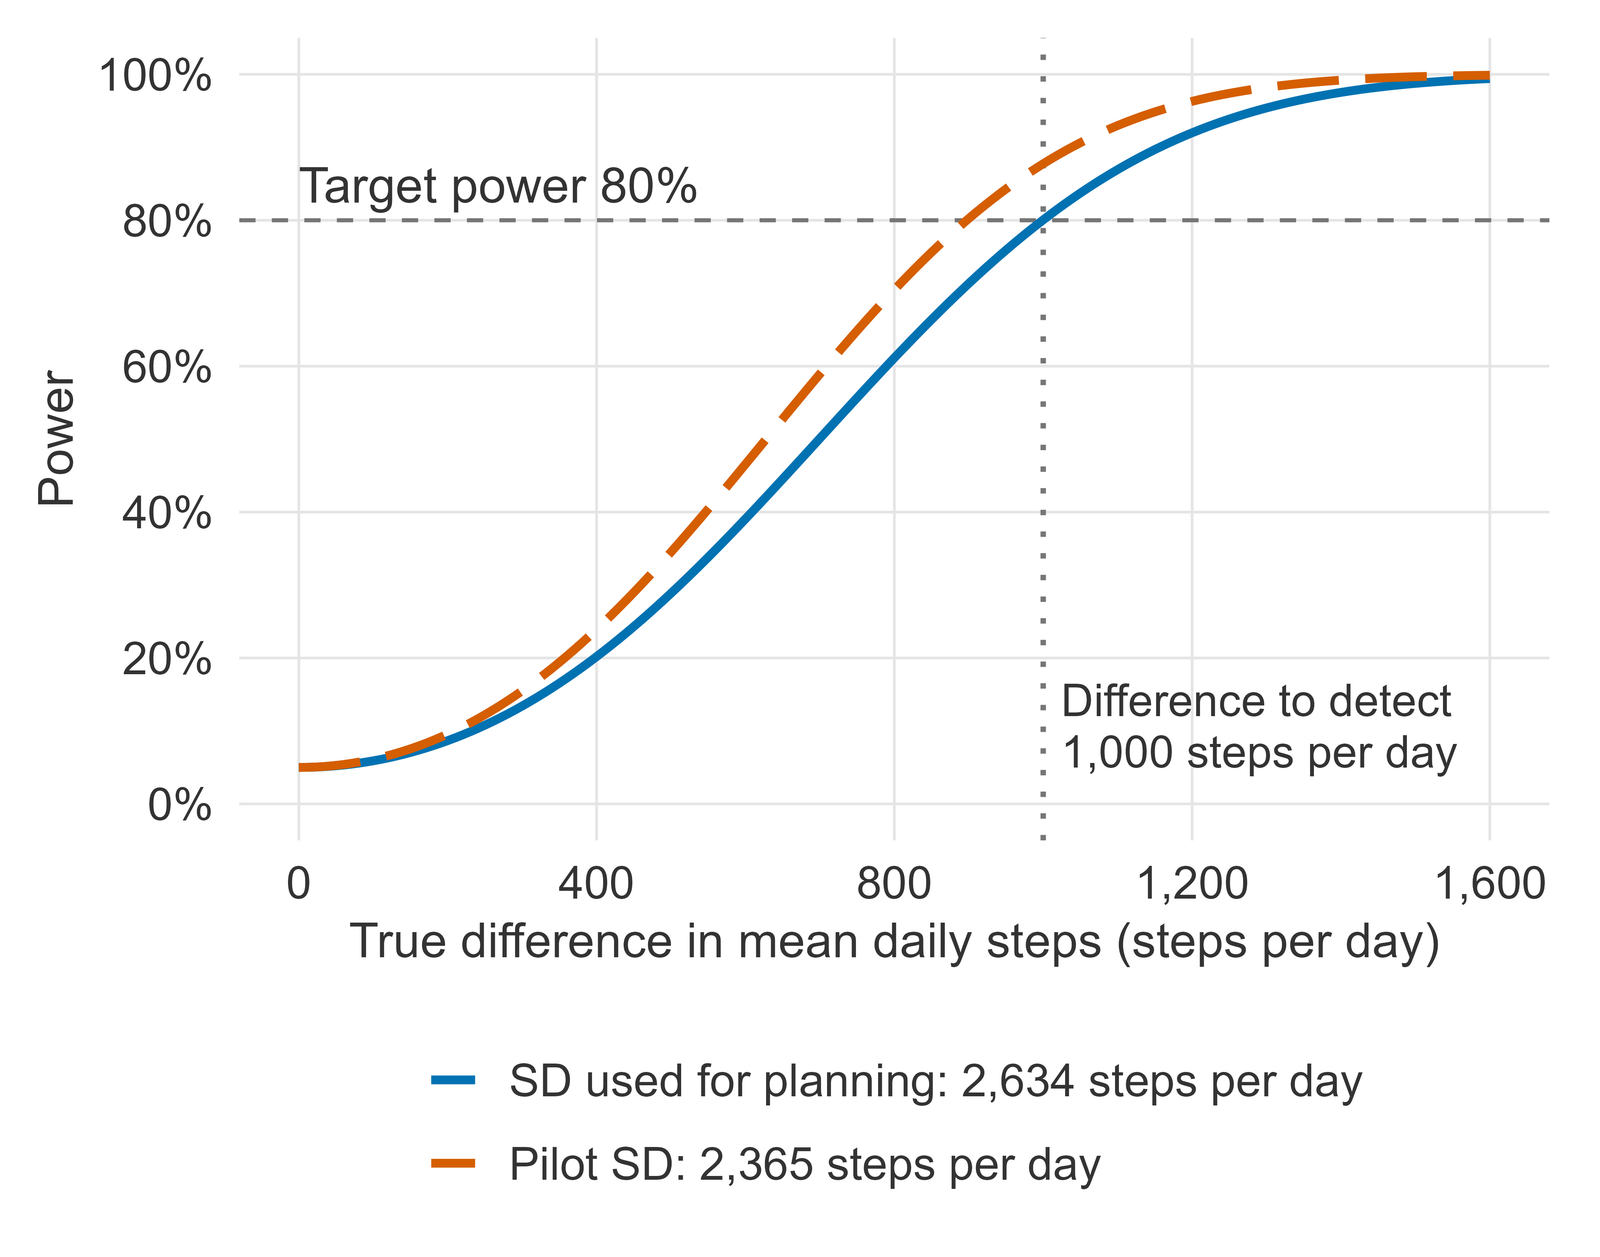
How to read Figure 1: follow a curve to any true difference to read the power the study would have. With the standard deviation used for planning, power reaches 80% at a difference of 999 steps per day (just under 1,000, because the number of analysable staff was rounded up to whole staff) and is about 56% at 750 steps per day. If the true standard deviation is close to the pilot estimate, power at 1,000 steps per day is about 88%.วิธีอ่านรูป 1: ไล่ตามเส้นโค้งไปยังผลต่างที่แท้จริงค่าใดก็ได้ เพื่ออ่านค่า power ที่การศึกษาจะมี เมื่อใช้ SD ที่ใช้วางแผน power จะถึง 80% ที่ผลต่าง 999 ก้าวต่อวัน (ต่ำกว่า 1,000 เล็กน้อย เพราะจำนวนผู้ที่วิเคราะห์ได้ถูกปัดขึ้นเป็นจำนวนคนเต็ม) และมีค่าประมาณ 56% ที่ผลต่าง 750 ก้าวต่อวัน หาก SD ที่แท้จริงใกล้เคียงกับค่าจากการศึกษานำร่อง power ที่ผลต่าง 1,000 ก้าวต่อวันจะมีค่าประมาณ 88%
Statistical analysisการวิเคราะห์ทางสถิติ
- Analysis population: all randomised staff, analysed in the arm they were allocated to (intention to treat).ประชากรที่ใช้วิเคราะห์: พนักงานทุกคนที่ได้รับการสุ่ม วิเคราะห์ตามกลุ่มที่ได้รับการจัดสรร (intention to treat)
- Primary analysis: the mean daily step count in the final week of follow-up is compared between the arms by linear regression adjusted for the baseline mean daily step count (ANCOVA), reported as the adjusted difference in means with its 95% confidence interval and P value. The baseline value is the mean daily step count over the week before randomisation, recorded with the same step counter before any feedback message.การวิเคราะห์หลัก: เปรียบเทียบค่าเฉลี่ยจำนวนก้าวต่อวันในสัปดาห์สุดท้ายของการติดตามระหว่างสองกลุ่มด้วยการถดถอยเชิงเส้นที่ปรับค่าเฉลี่ยจำนวนก้าวต่อวันก่อนเริ่มการศึกษา (ANCOVA) รายงานเป็นผลต่างของค่าเฉลี่ยที่ปรับแล้ว พร้อมช่วงความเชื่อมั่น 95% และค่า P ค่าก่อนเริ่มการศึกษา คือค่าเฉลี่ยจำนวนก้าวต่อวันในสัปดาห์ก่อนการสุ่ม วัดด้วยเครื่องนับก้าวเครื่องเดียวกันก่อนได้รับข้อความป้อนกลับใด ๆ
- Secondary analyses: reaching 7,500 steps per day by logistic regression, reported as an adjusted odds ratio and as a risk difference by marginal standardisation, and body weight by linear regression, each adjusted for its baseline value. They are reported with 95% confidence intervals, without adjustment for multiple comparisons, and read as supporting results.การวิเคราะห์รอง: สัดส่วนผู้ที่เดินได้ถึง 7,500 ก้าวต่อวัน วิเคราะห์ด้วยการถดถอยโลจิสติก รายงานเป็น adjusted odds ratio และผลต่างของความเสี่ยง (risk difference) ที่คำนวณจากโมเดลโลจิสติกด้วยวิธี marginal standardisation ส่วนน้ำหนักตัววิเคราะห์ด้วยการถดถอยเชิงเส้น แต่ละโมเดลปรับค่าก่อนเริ่มการศึกษาของตัวแปรนั้น รายงานพร้อมช่วงความเชื่อมั่น 95% โดยไม่ปรับสำหรับการเปรียบเทียบพหุคูณ (multiple comparisons) และใช้เป็นผลสนับสนุนเท่านั้น
- Missing data: missing outcomes are handled by multiple imputation by chained equations under a missing-at-random assumption, with 20 imputed data sets combined by Rubin's rules. The imputation model holds the arm, the baseline value, the weekly mean step counts observed during follow-up, the number of days the step counter was worn during follow-up, age group and sex. Reaching 7,500 steps per day is derived from the imputed step count, not imputed separately. A complete-case analysis is reported as a sensitivity analysis.ข้อมูลที่ขาดหาย: จัดการผลลัพธ์ที่ขาดหายด้วยการแทนค่าข้อมูลที่ขาดหายแบบหลายชุด (multiple imputation by chained equations) ภายใต้ข้อสมมติว่าข้อมูลขาดหายแบบสุ่ม (missing at random) สร้างชุดข้อมูลที่แทนค่าแล้ว 20 ชุด และรวมผลด้วยกฎของ Rubin (Rubin's rules) โมเดลสำหรับการแทนค่าประกอบด้วยกลุ่มที่ได้รับการสุ่ม ค่าก่อนเริ่มการศึกษา ค่าเฉลี่ยจำนวนก้าวรายสัปดาห์ที่วัดได้ระหว่างการติดตาม จำนวนวันที่สวมเครื่องนับก้าวระหว่างการติดตาม กลุ่มอายุ และเพศ ผลลัพธ์ว่าเดินได้ถึง 7,500 ก้าวต่อวันหรือไม่ คำนวณจากจำนวนก้าวที่แทนค่าแล้ว ไม่ได้แทนค่าแยกต่างหาก ส่วนการวิเคราะห์เฉพาะผู้ที่มีข้อมูลครบ (complete-case analysis) รายงานเป็นการวิเคราะห์ความไว (sensitivity analysis)
- Significance level: two-sided 0.05 for the primary outcome; secondary results are judged by their confidence intervals.ระดับนัยสำคัญ: 0.05 แบบสองทางสำหรับผลลัพธ์หลัก ส่วนผลลัพธ์รองพิจารณาจากช่วงความเชื่อมั่น
- Software: R version 4.6.1, with the stats package for the regression models and the mice package for multiple imputation.ซอฟต์แวร์: R เวอร์ชัน 4.6.1 ใช้แพ็กเกจ stats สำหรับโมเดลการถดถอย และแพ็กเกจ mice สำหรับการแทนค่าข้อมูลที่ขาดหายแบบหลายชุด
| Outcome | Type | Analysis | Reported as |
|---|---|---|---|
| Primary outcome | |||
| Mean daily steps, final week | Continuous | Linear regression on arm and baseline mean daily steps (ANCOVA) | Adjusted difference in means, 95% CI and P value |
| Secondary outcomes | |||
| Reaching 7,500 steps per day, final week | Binary | Logistic regression on arm and baseline mean daily steps | Adjusted odds ratio (95% CI, Wald) and risk difference by marginal standardisation from the logistic model (95% CI, delta method) |
| Body weight at the end of follow-up, kg | Continuous | Linear regression on arm and baseline body weight (ANCOVA) | Adjusted difference in means, 95% CI |
| Sensitivity analysis | |||
| Mean daily steps, complete cases | Continuous | Primary model on staff with an observed outcome, without imputation | Adjusted difference in means, 95% CI and P value |
- All analyses compare the arms as randomised. Missing outcomes in the primary and secondary analyses are imputed as described in the text, and the estimates are pooled over the imputed data sets by Rubin's rules; the sensitivity analysis uses complete cases only.ทุกการวิเคราะห์เปรียบเทียบตามกลุ่มที่ได้รับการสุ่ม ผลลัพธ์ที่ขาดหายในการวิเคราะห์หลักและการวิเคราะห์รองได้รับการแทนค่าตามที่อธิบายในเนื้อความ และรวมค่าประมาณจากชุดข้อมูลที่แทนค่าแล้วด้วยกฎของ Rubin ส่วนการวิเคราะห์ความไวใช้เฉพาะผู้ที่มีข้อมูลครบ
How to read Table 2: each row is one planned analysis, giving the outcome, its type, the model written out in words and what will be reported. The models are fitted only after the study ends, so this sample holds no results.วิธีอ่านตาราง 2: แต่ละแถวคือการวิเคราะห์หนึ่งรายการตามแผน ระบุผลลัพธ์ ชนิดของตัวแปร โมเดลที่เขียนบรรยายไว้ และค่าที่จะรายงาน โมเดลเหล่านี้จะใช้วิเคราะห์ข้อมูลหลังการศึกษาสิ้นสุดเท่านั้น ตัวอย่างนี้จึงไม่มีผลการวิเคราะห์
Data handlingการจัดการข้อมูล
- Analysis data set: the statistician receives only a de-identified analysis data set. It holds study codes, the arm, age group rather than exact age, sex and the step-counter and weight measurements; it holds no name, ID number, date of birth, contact detail or free text. It is pseudonymised rather than anonymous, because the linking key still exists with the research team.ชุดข้อมูลสำหรับวิเคราะห์: นักสถิติได้รับเฉพาะชุดข้อมูลที่ถอดข้อมูลระบุตัวตนออกแล้ว (de-identified) ซึ่งมีรหัสการศึกษา กลุ่มที่ได้รับการสุ่ม กลุ่มอายุแทนอายุจริง เพศ และค่าที่วัดได้จากเครื่องนับก้าวและน้ำหนักตัว โดยไม่มีชื่อ เลขประจำตัว วันเกิด ข้อมูลการติดต่อ หรือข้อความอิสระใด ๆ ชุดข้อมูลนี้เป็นข้อมูลแฝงตัวตน (pseudonymised) ไม่ใช่ข้อมูลนิรนาม เพราะคณะผู้วิจัยยังเก็บรายการเชื่อมโยงรหัสไว้
- Study codes: each participant is given a study code at enrolment, and only the code appears in the analysis data set and in every output.รหัสการศึกษา: ผู้เข้าร่วมแต่ละคนได้รับรหัสการศึกษาเมื่อเข้าร่วมโครงการ และมีเพียงรหัสนี้ที่ปรากฏในชุดข้อมูลสำหรับวิเคราะห์และในผลลัพธ์ทุกชิ้น
- Linking key: the list that links study codes to participants is kept by the research team in a separate, password-protected file. The statistician never holds or sees it.รายการเชื่อมโยงรหัส (linking key): รายการที่เชื่อมรหัสการศึกษากับตัวผู้เข้าร่วมเก็บโดยคณะผู้วิจัยในไฟล์แยกที่ตั้งรหัสผ่านไว้ นักสถิติไม่มีสำเนาและไม่เคยเห็นรายการนี้
- Access: the analysis data set is open to the research team and the statistician only; Table 3 lists who holds and who may open each file. The company and line managers receive group-level results only, never data for an individual staff member.การเข้าถึง: ชุดข้อมูลสำหรับวิเคราะห์เปิดได้เฉพาะคณะผู้วิจัยและนักสถิติ ตาราง 3 ระบุผู้เก็บรักษาและผู้มีสิทธิ์เปิดไฟล์แต่ละไฟล์ บริษัทและผู้บังคับบัญชาได้รับเฉพาะผลในระดับกลุ่ม ไม่ได้รับข้อมูลรายบุคคลของพนักงาน
- Storage and transfer: files are stored encrypted on storage the institution approves and reach the statistician through an encrypted channel, never as an open e-mail attachment.การจัดเก็บและการส่งต่อ: ไฟล์จัดเก็บแบบเข้ารหัสบนระบบจัดเก็บที่สถาบันอนุมัติ และส่งถึงนักสถิติผ่านช่องทางที่เข้ารหัส ไม่ส่งเป็นไฟล์แนบอีเมลที่ไม่ได้เข้ารหัส
- Retention: the data are kept according to the institution's rule.ระยะเวลาการเก็บรักษา: เก็บรักษาข้อมูลตามระเบียบของสถาบัน
- Destruction: at the end of the retention period the research team destroys the linking key and the data sets. The statistician deletes the working copy once all analyses, including any re-analysis requested during peer review, are complete, and confirms the deletion in writing.การทำลายข้อมูล: เมื่อครบระยะเวลาการเก็บรักษา คณะผู้วิจัยเป็นผู้ทำลายรายการเชื่อมโยงรหัสและชุดข้อมูล ส่วนนักสถิติจะลบสำเนาที่ใช้ทำงานเมื่อการวิเคราะห์ทั้งหมดเสร็จสิ้น รวมถึงการวิเคราะห์ซ้ำตามที่ผู้ทบทวนของวารสารขอ และยืนยันการลบเป็นลายลักษณ์อักษร
| File | Held by | Who may open it | Identifies a person |
|---|---|---|---|
| Linking key: study code to name | Research team (principal investigator) | Named members of the research team | Yes |
| Step-counter export files | Research team | Research team | Possibly: device account names are removed before analysis |
| De-identified analysis data set | Research team (master copy) | Research team and the statistician | Not directly: pseudonymised with study codes, age group instead of age; the linking key stays with the research team |
| Statistician's working copy and analysis files | Statistician, until the analysis and any peer-review re-analysis are complete | Statistician; results go to the research team | Not directly: pseudonymised, study codes only |
| Group-level results report | Research team | Research team; the company and line managers receive this report only | No: group summaries only, no data for an individual staff member |
- The linking key is the file that names participants, and it never leaves the research team. Export files can carry device account names, which the research team removes before it makes the analysis data set.รายการเชื่อมโยงรหัสเป็นไฟล์ที่มีชื่อผู้เข้าร่วม และไม่ออกไปนอกคณะผู้วิจัย ไฟล์ส่งออกจากเครื่องนับก้าวอาจมีชื่อบัญชีผู้ใช้อุปกรณ์ ซึ่งคณะผู้วิจัยลบออกก่อนจัดทำชุดข้อมูลสำหรับวิเคราะห์
How to read Table 3: each row is one file, with who keeps it, who may open it and whether it can identify a person. Only the research team can link a study code to a name, and the company sees group-level results only.วิธีอ่านตาราง 3: แต่ละแถวคือไฟล์หนึ่งไฟล์ ระบุผู้เก็บรักษา ผู้มีสิทธิ์เปิด และไฟล์นั้นระบุตัวบุคคลได้หรือไม่ มีเพียงคณะผู้วิจัยที่เชื่อมโยงรหัสการศึกษากลับไปยังชื่อได้ และบริษัทเห็นเฉพาะผลในระดับกลุ่ม
Answers to the committeeการตอบข้อเสนอแนะของคณะกรรมการ
The comments below are invented, written as a committee might write them about these sections. Each row gives the comment, the answer and the change made in the document; the sections above already include the changes.ข้อเสนอแนะด้านล่างเป็นข้อความสมมติ เขียนในแบบที่คณะกรรมการอาจเขียนถึงส่วนเหล่านี้ แต่ละแถวประกอบด้วยข้อเสนอแนะ คำตอบ และสิ่งที่แก้ไขในเอกสาร โดยส่วนต่าง ๆ ด้านบนเป็นฉบับที่แก้ไขแล้ว
- Commentความเห็น
- Please justify the standard deviation used in the sample-size calculation.โปรดให้เหตุผลประกอบค่าส่วนเบี่ยงเบนมาตรฐานที่ใช้ในการคำนวณขนาดตัวอย่าง
- Statistical answerคำตอบเชิงสถิติ
- The standard deviation comes from a pilot of 40 staff who wore the same step counter, 2,365 steps per day. Because a pilot of this size estimates it imprecisely, the calculation uses the upper limit of its one-sided 80% confidence interval, 2,634 steps per day, which makes the sample size larger rather than smaller.ค่า SD ได้จากการศึกษานำร่องในพนักงาน 40 คนที่สวมเครื่องนับก้าวรุ่นเดียวกัน มีค่า 2,365 ก้าวต่อวัน เนื่องจากการศึกษานำร่องขนาดนี้ประมาณค่า SD ได้ไม่แม่นยำ การคำนวณจึงใช้ขีดจำกัดบนของช่วงความเชื่อมั่นด้านเดียว 80% ซึ่งเท่ากับ 2,634 ก้าวต่อวัน ทำให้ได้ขนาดตัวอย่างที่มากขึ้น ไม่ใช่น้อยลง
- Change madeสิ่งที่แก้ไข
- The source of the standard deviation and the use of its upper confidence limit are now stated in the sample-size section and in Table 1.ระบุที่มาของค่า SD และการใช้ขีดจำกัดบนของช่วงความเชื่อมั่นไว้ในส่วนการคำนวณขนาดตัวอย่างและในตาราง 1 แล้ว
- Commentความเห็น
- What happens if the true difference is smaller than the one assumed?หากผลต่างที่แท้จริงเล็กกว่าที่สมมติไว้ จะเกิดอะไรขึ้น
- Statistical answerคำตอบเชิงสถิติ
- With 130 staff enrolled per arm and 15% dropout, power stays at 80% or more for any difference from 999 steps per day upward, and falls to about 56% at 750 steps per day. The difference to detect remains the research team's choice and is unchanged.เมื่อรับพนักงานกลุ่มละ 130 คนและมีอัตราการถอนตัว 15% อำนาจการทดสอบจะไม่ต่ำกว่า 80% สำหรับผลต่างตั้งแต่ 999 ก้าวต่อวันขึ้นไป และจะลดลงเหลือประมาณ 56% ที่ผลต่าง 750 ก้าวต่อวัน ผลต่างที่ต้องการตรวจพบยังเป็นการตัดสินใจของคณะผู้วิจัยและไม่เปลี่ยนแปลง
- Change madeสิ่งที่แก้ไข
- Figure 1, a power curve across true differences, is added to the sample-size section.เพิ่มรูป 1 ซึ่งเป็นกราฟ power ตามขนาดของผลต่างที่แท้จริง ไว้ในส่วนการคำนวณขนาดตัวอย่าง
- Commentความเห็น
- The analysis adjusts for baseline steps but the sample size does not. Could fewer staff be enrolled?การวิเคราะห์ปรับค่าจำนวนก้าวก่อนเริ่มการศึกษา แต่การคำนวณขนาดตัวอย่างไม่ได้ปรับ จะลดจำนวนพนักงานที่รับเข้าได้หรือไม่
- Statistical answerคำตอบเชิงสถิติ
- In the pilot the two weeks correlated at r = 0.65; with that correlation an adjusted analysis would need about 64 analysable staff per arm instead of 110. The unadjusted number is kept on purpose: the correlation between two weeks close together is likely higher than between baseline and the end of a 12-week programme, and a pilot of 40 staff estimates it imprecisely.ในการศึกษานำร่อง จำนวนก้าวของสองสัปดาห์มีสหสัมพันธ์ r = 0.65 หากใช้ค่านี้ การวิเคราะห์ที่ปรับค่าก่อนเริ่มการศึกษาจะต้องการผู้ที่วิเคราะห์ได้ประมาณ 64 คนต่อกลุ่ม แทน 110 คน แต่คณะผู้วิจัยตั้งใจคงจำนวนจากการคำนวณที่ไม่ปรับค่าก่อนเริ่มการศึกษาไว้ เพราะสหสัมพันธ์ระหว่างสองสัปดาห์ที่ห่างกันไม่นานน่าจะสูงกว่าสหสัมพันธ์ระหว่างค่าก่อนเริ่มกับค่าเมื่อสิ้นสุดโปรแกรม 12 สัปดาห์ และการศึกษานำร่อง 40 คนประมาณค่านี้ได้ไม่แม่นยำ
- Change madeสิ่งที่แก้ไข
- A short paragraph explaining this choice is added to the sample-size section; the numbers are unchanged.เพิ่มย่อหน้าสั้น ๆ อธิบายเหตุผลนี้ในส่วนการคำนวณขนาดตัวอย่าง โดยตัวเลขไม่เปลี่ยนแปลง
- Commentความเห็น
- A complete-case analysis alone may be biased if dropout is related to activity. How will missing outcomes be handled?การวิเคราะห์เฉพาะผู้ที่มีข้อมูลครบเพียงอย่างเดียวอาจมีอคติ หากการถอนตัวสัมพันธ์กับระดับกิจกรรมทางกาย จะจัดการกับผลลัพธ์ที่ขาดหายอย่างไร
- Statistical answerคำตอบเชิงสถิติ
- The primary analysis now uses multiple imputation by chained equations under a missing-at-random assumption, with 20 imputed data sets. The imputation model includes the weekly step counts observed during follow-up and the number of days the step counter was worn, which are likely related to both dropout and activity. The complete-case analysis is kept as a sensitivity analysis.การวิเคราะห์หลักเปลี่ยนมาใช้การแทนค่าข้อมูลที่ขาดหายแบบหลายชุด (multiple imputation by chained equations) ภายใต้ข้อสมมติว่าข้อมูลขาดหายแบบสุ่ม (missing at random) โดยสร้างชุดข้อมูลที่แทนค่าแล้ว 20 ชุด โมเดลการแทนค่ารวมจำนวนก้าวรายสัปดาห์ที่วัดได้ระหว่างการติดตามและจำนวนวันที่สวมเครื่องนับก้าว ซึ่งน่าจะสัมพันธ์ทั้งกับการถอนตัวและกับระดับกิจกรรม และยังคงการวิเคราะห์เฉพาะผู้ที่มีข้อมูลครบไว้เป็นการวิเคราะห์ความไว
- Change madeสิ่งที่แก้ไข
- The missing-data paragraph of the statistical analysis section and the sensitivity row of Table 2 are rewritten.เขียนข้อความเรื่องข้อมูลที่ขาดหายในส่วนการวิเคราะห์ทางสถิติ และแถวการวิเคราะห์ความไวในตาราง 2 ใหม่
- Commentความเห็น
- Please state who can link the study codes back to participants, whether the statistician receives identifying data, and how long the data are kept.โปรดระบุว่าผู้ใดเชื่อมโยงรหัสการศึกษากลับไปยังตัวผู้เข้าร่วมได้ นักสถิติได้รับข้อมูลที่ระบุตัวตนหรือไม่ และเก็บรักษาข้อมูลนานเท่าใด
- Statistical answerคำตอบเชิงสถิติ
- Only the research team holds the linking key. The statistician receives the de-identified analysis data set with study codes and never sees names, ID numbers or contact details. The data are kept according to the institution's rule, and the statistician's working copy is deleted when the analysis, including any re-analysis requested during peer review, is complete.มีเพียงคณะผู้วิจัยที่ถือรายการเชื่อมโยงรหัส นักสถิติได้รับเฉพาะชุดข้อมูลสำหรับวิเคราะห์ที่ถอดข้อมูลระบุตัวตนออกแล้วซึ่งมีรหัสการศึกษา และไม่เห็นชื่อ เลขประจำตัว หรือข้อมูลการติดต่อ ข้อมูลเก็บรักษาตามระเบียบของสถาบัน และสำเนาที่นักสถิติใช้ทำงานจะถูกลบเมื่อการวิเคราะห์ทั้งหมด รวมถึงการวิเคราะห์ซ้ำที่ผู้ทบทวนขอ เสร็จสิ้นแล้ว
- Change madeสิ่งที่แก้ไข
- The data-handling section now names the holder of the linking key, the retention rule and the deletion of the working copy, and Table 3 lists who holds and who may open each file.ส่วนการจัดการข้อมูลระบุผู้ถือรายการเชื่อมโยงรหัส ระเบียบการเก็บรักษา และการลบสำเนาที่ใช้ทำงานแล้ว และเพิ่มตาราง 3 ที่ระบุผู้เก็บรักษาและผู้มีสิทธิ์เปิดไฟล์แต่ละไฟล์
Limits of this sampleข้อจำกัดของตัวอย่างนี้
- The study, the company, the pilot, the committee and its comments are invented, and the pilot data are simulated; no number here describes real staff.การศึกษา บริษัท การศึกษานำร่อง คณะกรรมการ และข้อเสนอแนะเป็นเรื่องสมมติ ข้อมูลการศึกษานำร่องเป็นข้อมูลจำลอง ไม่มีตัวเลขใดในหน้านี้ที่บรรยายพนักงานจริง
- The difference to detect, the dropout allowance, the power and the outcomes are the research team's decisions. The statistician shows what each choice does to the numbers but does not decide what difference matters.ผลต่างที่ต้องการตรวจพบ อัตราการถอนตัวที่เผื่อไว้ อำนาจการทดสอบ และผลลัพธ์ที่วัด เป็นการตัดสินใจของคณะผู้วิจัย นักสถิติแสดงให้เห็นว่าการเลือกแต่ละอย่างส่งผลต่อตัวเลขอย่างไร แต่ไม่ได้ตัดสินว่าผลต่างขนาดใดมีความสำคัญ
- The sample holds no study results and no interpretation: the models in Table 2 are fitted only after the study, and interpreting them belongs to the research team.ตัวอย่างนี้ไม่มีผลการศึกษาและไม่มีการแปลผล โมเดลในตาราง 2 จะใช้วิเคราะห์ข้อมูลหลังการศึกษาเสร็จสิ้นเท่านั้น และการแปลผลเป็นหน้าที่ของคณะผู้วิจัย
- Headings, retention periods, storage systems and form layouts follow each institution's own rules; this sample states them in general terms only.หัวข้อ ระยะเวลาการเก็บรักษา ระบบจัดเก็บข้อมูล และรูปแบบแบบฟอร์ม เป็นไปตามระเบียบของแต่ละสถาบัน ตัวอย่างนี้ระบุไว้เพียงในภาพรวม
What you send and do yourselfสิ่งที่คุณต้องส่งและทำเอง
- Your protocol and the committee's form or required headings.โครงร่างวิจัย และแบบฟอร์มหรือหัวข้อที่คณะกรรมการกำหนด
- You write every other section of the submission, and you make the submission yourself.คุณเป็นผู้เขียนส่วนอื่นทั้งหมดของเอกสาร และเป็นผู้ยื่นเอกสารเอง
- The committee's comments, when they arrive.ความเห็นของคณะกรรมการ เมื่อได้รับแล้ว
- You acknowledge the statistical help in the way your journal or committee asks.คุณระบุความช่วยเหลือด้านสถิติตามรูปแบบที่วารสารหรือคณะกรรมการกำหนด
Limitsขอบเขตและข้อจำกัด
- Statistical analysis and advice only: the research question, the data, the interpretation and the writing stay yours.บริการนี้เป็นงานวิเคราะห์และให้คำแนะนำทางสถิติเท่านั้น คำถามวิจัย ข้อมูล การแปลผล และการเขียน เป็นของคุณทั้งหมด
- The statistical and data-handling parts only, never the whole submission.เฉพาะส่วนสถิติและการจัดการข้อมูล ไม่ใช่เอกสารทั้งชุด
- This is not legal advice; your institution's rules and data-protection law still apply.บริการนี้ไม่ใช่คำแนะนำทางกฎหมาย คุณยังต้องปฏิบัติตามระเบียบของสถาบันและกฎหมายคุ้มครองข้อมูลส่วนบุคคล
- Not for a thesis, an independent study or other work submitted for a degree; for those, I offer consultation only.ไม่รับทำงานที่จะนำไปใช้เพื่อสำเร็จการศึกษา เช่น วิทยานิพนธ์ การค้นคว้าอิสระ หรือผลงานอื่นที่ยื่นเพื่อรับปริญญา งานลักษณะนี้รับเฉพาะการให้คำปรึกษา
- Authorship is not sold and is not a condition of the service.การมีชื่อเป็นผู้นิพนธ์ไม่ใช่สิ่งที่ซื้อขายได้ และไม่ใช่เงื่อนไขในการรับงาน
Request this serviceขอใช้บริการนี้
Every request is reviewed first. I may accept or decline it. The timeline is agreed per project after review.ผมพิจารณาคำขอทุกงานก่อน และอาจรับหรือปฏิเสธงาน ระยะเวลาของแต่ละงานตกลงกันหลังพิจารณาคำขอแล้ว
Member prices apply only to orders that start on uniqcret.com; if you found me on Fastwork or your enquiry began there, please order on Fastwork at the Fastwork price.ราคาสมาชิกใช้กับงานที่เริ่มต้นบน uniqcret.com เท่านั้น หากคุณรู้จักผมจาก Fastwork หรือเริ่มสอบถามบน Fastwork กรุณาสั่งงานบน Fastwork ในราคาของ Fastwork