Diagnostic accuracy and agreementความแม่นยำของการวินิจฉัยและความสอดคล้องของการวัด
Diagnostic accuracy and agreement: ROC and AUC, cut-offs, kappa, ICC and Bland-Altmanความแม่นยำของการตรวจและความสอดคล้องของการวัด: ROC และ AUC จุดตัด kappa ICC และ Bland-Altman
An invented community health programme for older adults ran three small method studies. In the first, 300 participants took a smartphone hearing-screening test, which gives a continuous score (a higher score means poorer hearing), and pure-tone audiometry by an audiologist, the reference standard; 78 of them had hearing loss on audiometry. In the second, two physiotherapists, each without seeing the other's grades, graded the same 120 recorded sit-to-stand videos on an ordered scale of 4 grades of movement quality, from excellent to poor. In the third, 100 participants wore a wrist-worn optical heart-rate monitor and a chest-strap ECG monitor at the same time, and both readings were taken at the end of a step test. The programme, the people and every value are invented: all data are simulated with a fixed seed.โครงการสุขภาพชุมชนสำหรับผู้สูงอายุแห่งหนึ่ง (สมมุติ) ทำการศึกษาขนาดเล็กสามเรื่องเพื่อประเมินวิธีการวัด เรื่องแรก ผู้เข้าร่วม 300 คนได้รับการตรวจคัดกรองการได้ยินด้วยแอปบนสมาร์ตโฟน ซึ่งให้ผลเป็นคะแนนต่อเนื่อง (คะแนนยิ่งสูง การได้ยินยิ่งแย่) และได้รับการตรวจ pure-tone audiometry โดยนักแก้ไขการได้ยิน ซึ่งใช้เป็นมาตรฐานอ้างอิง (reference standard) ในจำนวนนี้ 78 คนมีภาวะการได้ยินบกพร่องจากผล audiometry เรื่องที่สอง นักกายภาพบำบัดสองคนให้เกรดคุณภาพการเคลื่อนไหวแก่วิดีโอการลุกจากเก้าอี้ (sit-to-stand) ชุดเดียวกัน 120 คลิป โดยต่างคนต่างประเมินและไม่เห็นเกรดของอีกฝ่าย ตามมาตรวัดแบบเรียงลำดับ 4 ระดับ ตั้งแต่ดีเยี่ยมจนถึงไม่ดี เรื่องที่สาม ผู้เข้าร่วม 100 คนสวมอุปกรณ์วัดอัตราการเต้นของหัวใจแบบแสงที่ข้อมือ และสายคาดอกวัดคลื่นไฟฟ้าหัวใจ (ECG) พร้อมกัน แล้วอ่านค่าจากทั้งสองเครื่องเมื่อจบการทดสอบก้าวขึ้นลงขั้นบันได (step test) โครงการ ผู้เข้าร่วม และค่าทุกค่าเป็นเรื่องสมมุติ ข้อมูลทั้งหมดเป็นข้อมูลจำลองที่สร้างด้วย seed คงที่
What you receiveสิ่งที่คุณจะได้รับ
The accuracy of an index test against a reference standard, ROC analysis and cut-offs, and agreement between raters or between two ways of measuring.วิเคราะห์ความแม่นยำของการทดสอบเทียบกับมาตรฐานอ้างอิง วิเคราะห์กราฟ ROC และจุดตัด รวมถึงความสอดคล้องระหว่างผู้ประเมิน หรือระหว่างวิธีวัดสองวิธี
- Sensitivity, specificity, predictive values and likelihood ratios, each with a 95% confidence interval.ค่าความไว ความจำเพาะ ค่าพยากรณ์ผลบวกและผลลบ และ likelihood ratio พร้อมช่วงความเชื่อมั่น 95% ทุกค่า
- An ROC curve, the area under the curve and a cut-off chosen by a rule agreed before the analysis.กราฟ ROC พื้นที่ใต้โค้ง (AUC) และจุดตัดที่เลือกตามเกณฑ์ซึ่งตกลงกันไว้ก่อนวิเคราะห์
- Cohen's kappa (weighted kappa for ordered categories) for agreement on categorical ratings, the ICC for the reliability of continuous measurements, and a Bland-Altman plot with limits of agreement when two methods measure the same quantity, as your design needs.ค่า Cohen's kappa (หรือ weighted kappa สำหรับข้อมูลจัดลำดับ) สำหรับความสอดคล้องของผลประเมินแบบจัดกลุ่ม ค่า ICC สำหรับความน่าเชื่อถือของค่าที่วัดแบบต่อเนื่อง และกราฟ Bland-Altman พร้อมขอบเขตความสอดคล้อง (limits of agreement) เมื่อใช้สองวิธีวัดสิ่งเดียวกัน ตามที่รูปแบบการศึกษาต้องการ
- Result tables and figures, with a short record of the methods used.ตารางและกราฟผลการวิเคราะห์ พร้อมบันทึกสั้น ๆ ของวิธีการทางสถิติที่ใช้
The sampleตัวอย่างงาน
Sample work on simulated data. No real patient, no client project.ตัวอย่างงานจากข้อมูลจำลองทั้งหมด ไม่ใช่ข้อมูลผู้ป่วยจริง และไม่ใช่งานของลูกค้ารายใด
What this sample containsสิ่งที่อยู่ในตัวอย่างนี้
- Screening-test accuracy: the ROC curve with the AUC and its 95% CI, the cut-off chosen by Youden's index, the 2×2 table at that cut-off, and the sensitivity, specificity, predictive values and likelihood ratios, each with its 95% CI.ความแม่นยำของการตรวจคัดกรอง: ROC curve พร้อม AUC และ 95% CI จุดตัดที่เลือกด้วย Youden's index ตาราง 2×2 ที่จุดตัดนั้น และค่าความไว ความจำเพาะ ค่าพยากรณ์ และ likelihood ratio ทุกค่ามี 95% CI
- Agreement between two raters on an ordered scale: the cross-table of their grades, the observed agreement, Cohen's kappa and the weighted kappa, each kappa with its 95% CI.ความสอดคล้องระหว่างผู้ประเมินสองคนบนมาตรวัดแบบเรียงลำดับ: ตารางไขว้ของเกรดที่ให้ ความสอดคล้องที่สังเกตได้ Cohen's kappa และ weighted kappa โดยค่า kappa ทุกค่ามี 95% CI
- Agreement between two measurement methods: the ICC with its model stated in full, and a Bland-Altman analysis with the bias, the 95% limits of agreement and the 95% CI of each.ความสอดคล้องระหว่างวิธีวัดสองวิธี: ICC พร้อมระบุแบบจำลองที่ใช้อย่างครบถ้วน และการวิเคราะห์แบบ Bland-Altman ที่รายงาน bias และขอบเขตความสอดคล้อง 95% (95% limits of agreement) พร้อม 95% CI ของแต่ละค่า
- For every part, a short methods note, how to read each table and figure, and the limits of what the numbers can say.ทุกส่วนมีคำอธิบายวิธีการสั้น ๆ วิธีอ่านตารางและรูปแต่ละชิ้น และข้อจำกัดของสิ่งที่ตัวเลขเหล่านี้บอกได้
Screening test: ROC curve and cut-offการตรวจคัดกรอง: ROC curve และจุดตัด
Method. The ROC curve plots the sensitivity against the false-positive rate (one minus the specificity) at every possible cut-off of the app score, with audiometry as the reference standard. The area under the curve (AUC) is 0.84 (95% CI 0.79 to 0.89); the confidence interval uses DeLong's method. The cut-off was chosen to maximise Youden's index J, the sensitivity plus the specificity minus one: a score of 52 or more counts as a positive screen, with J = 0.57.วิธีการ: ROC curve แสดงความไวเทียบกับอัตราผลบวกลวง (หนึ่งลบความจำเพาะ) ที่ทุกจุดตัดที่เป็นไปได้ของคะแนนจากแอป โดยใช้ผล audiometry เป็นมาตรฐานอ้างอิง พื้นที่ใต้เส้นโค้ง (AUC) เท่ากับ 0.84 (95% CI 0.79 ถึง 0.89) ช่วงความเชื่อมั่นคำนวณด้วยวิธีของ DeLong จุดตัดเลือกจากค่า Youden's index (J) สูงสุด ซึ่งเท่ากับความไวบวกความจำเพาะแล้วลบด้วยหนึ่ง ได้เกณฑ์ว่าคะแนนตั้งแต่ 52 ขึ้นไปถือเป็นผลคัดกรองบวก โดยมีค่า J เท่ากับ 0.57
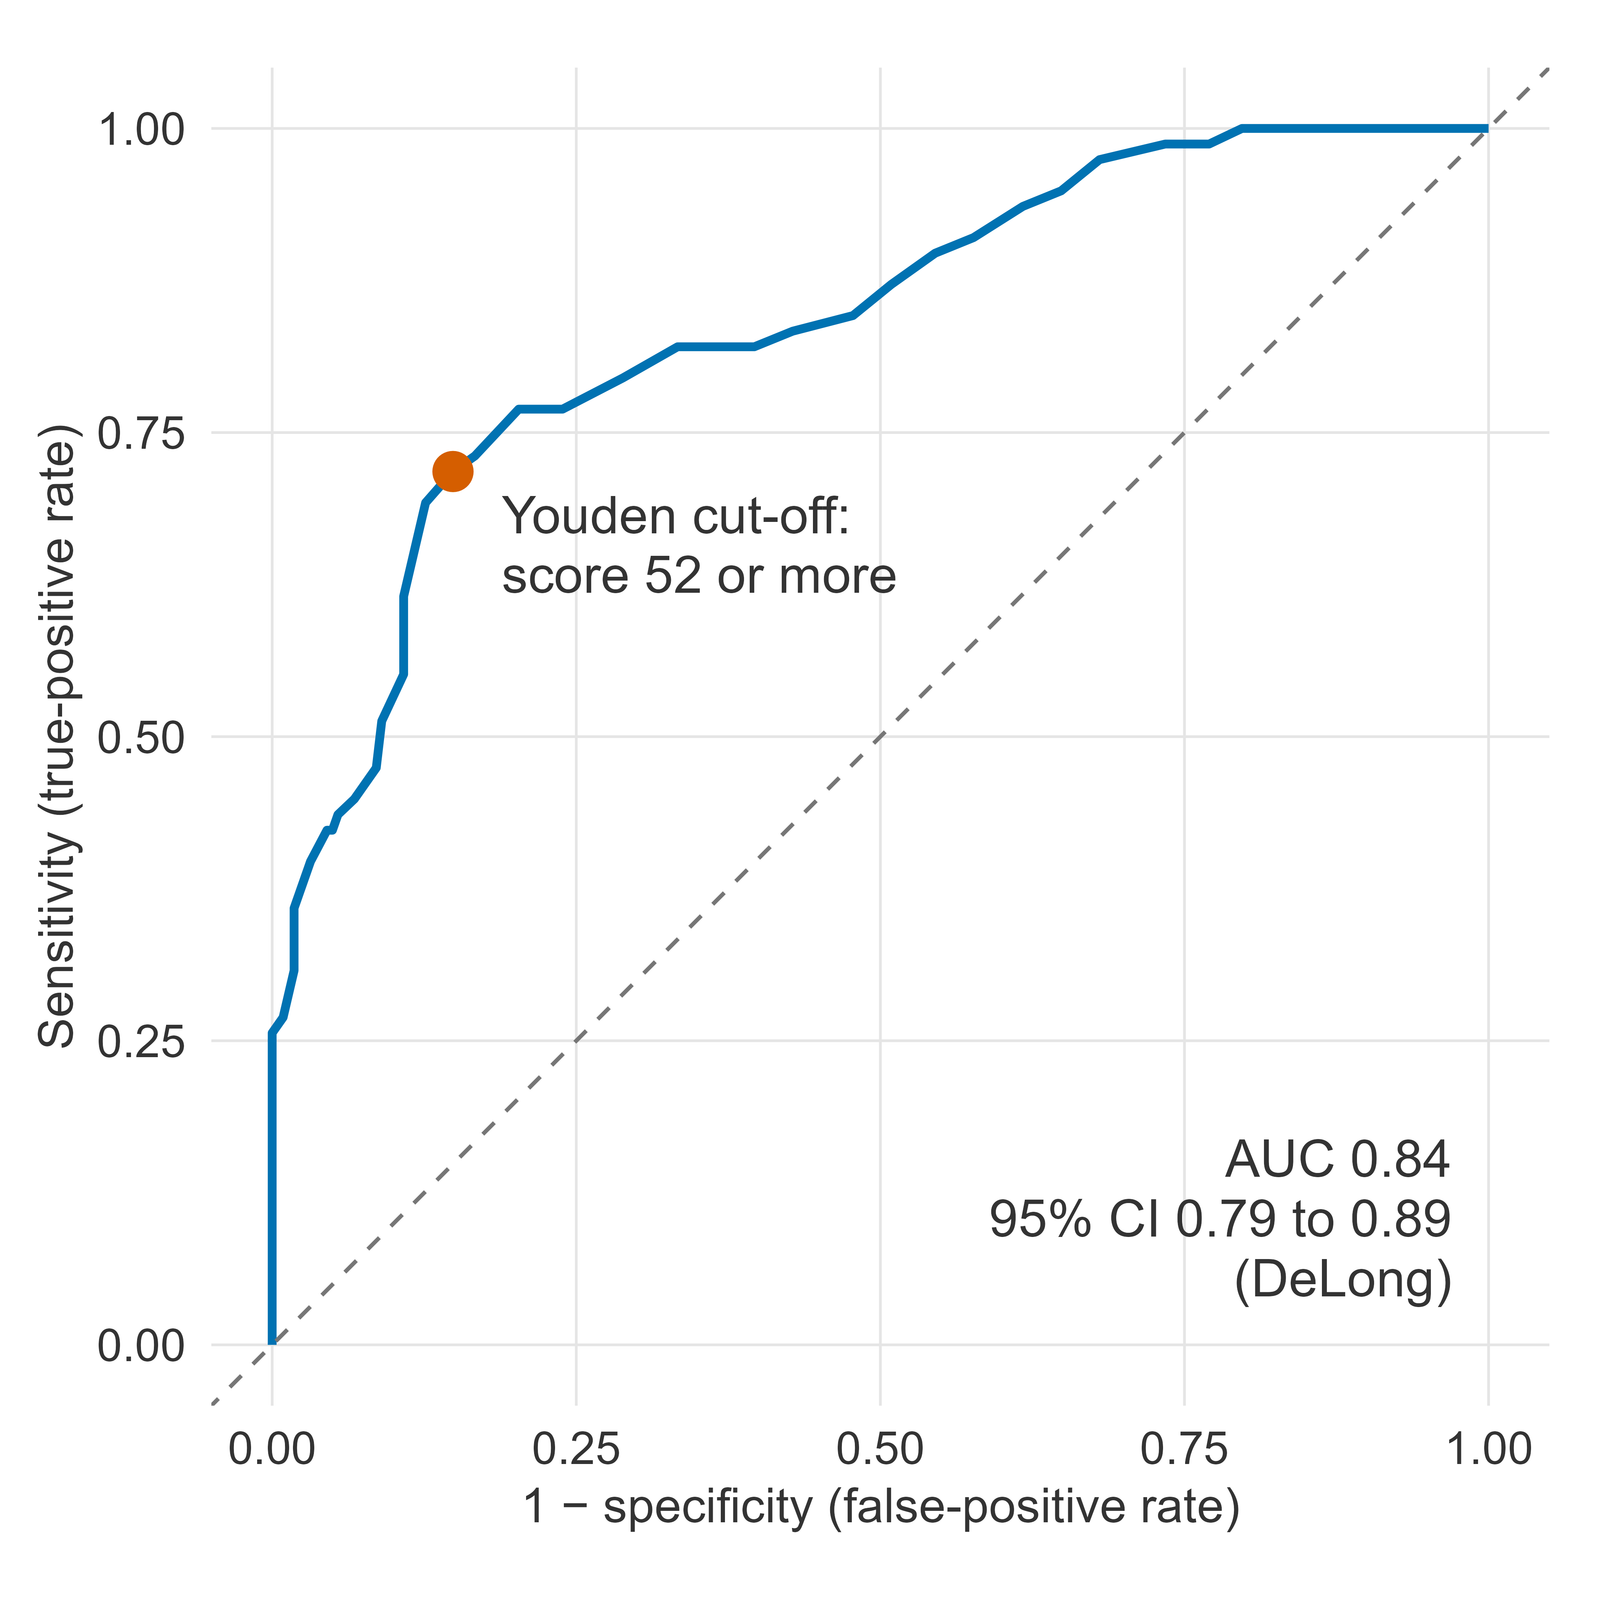
How to read it: each point on the curve is one possible cut-off. Moving down the curve to the left means a higher cut-off: fewer false positives, but also fewer true positives. The closer the curve runs to the upper-left corner, the better the score separates people with and without hearing loss. The AUC is the probability that a randomly chosen person with hearing loss scores higher than a randomly chosen person without it (a tie counts as half), and its 95% CI shows how precisely this sample estimates it.วิธีอ่าน: แต่ละจุดบนเส้นโค้งคือจุดตัดหนึ่งค่า การไล่ลงตามเส้นโค้งไปทางซ้ายหมายถึงจุดตัดที่สูงขึ้น ซึ่งให้ผลบวกลวงน้อยลง แต่ผลบวกจริงก็น้อยลงด้วย เส้นโค้งยิ่งเข้าใกล้มุมซ้ายบน คะแนนยิ่งแยกผู้ที่มีและไม่มีภาวะการได้ยินบกพร่องออกจากกันได้ดีขึ้น AUC คือความน่าจะเป็นที่ผู้มีภาวะการได้ยินบกพร่องซึ่งสุ่มมาหนึ่งคนจะได้คะแนนสูงกว่าผู้ไม่มีภาวะนี้ที่สุ่มมาหนึ่งคน (ถ้าคะแนนเท่ากันนับเป็นครึ่ง) ส่วน 95% CI บอกว่าตัวอย่างนี้ประมาณค่า AUC ได้แม่นยำเพียงใด
A cut-off chosen and evaluated in the same data is optimistic. Youden's index picks the cut-off that happens to work best in these 300 people, so the sensitivity and specificity at that cut-off will usually be lower in new people. A fair estimate needs a separate validation sample or a resampling method such as the bootstrap. Youden's index also weighs a missed case and a false alarm equally, which may not suit the purpose of a screen.จุดตัดที่เลือกและประเมินผลในข้อมูลชุดเดียวกันจะให้ผลดีเกินจริง (optimistic) เพราะ Youden's index เลือกจุดตัดที่บังเอิญให้ผลดีที่สุดในผู้เข้าร่วม 300 คนนี้ ความไวและความจำเพาะที่จุดตัดนี้จึงมักต่ำลงเมื่อนำไปใช้กับคนกลุ่มใหม่ การประมาณค่าที่ไม่เกินจริงต้องใช้ข้อมูลชุดตรวจสอบ (validation sample) แยกต่างหาก หรือใช้วิธี resampling เช่น bootstrap นอกจากนี้ Youden's index ให้น้ำหนักกับการพลาดผู้ที่มีภาวะและการให้ผลบวกลวงเท่ากัน ซึ่งอาจไม่ตรงกับวัตถุประสงค์ของการคัดกรอง
Accuracy at the cut-offความแม่นยำที่จุดตัด
Method. At the cut-off, every participant falls into one cell of the 2×2 table. The prevalence, sensitivity, specificity, PPV and NPV are proportions of those counts, each with an exact (Clopper-Pearson) 95% CI. The likelihood ratios are ratios of two proportions, so their 95% CIs use the log method: the standard error of the log likelihood ratio comes from the four counts, and the limits are transformed back.วิธีการ: ที่จุดตัดนี้ ผู้เข้าร่วมแต่ละคนจะอยู่ในเซลล์ใดเซลล์หนึ่งของตาราง 2×2 ความชุก ความไว ความจำเพาะ PPV และ NPV เป็นสัดส่วนที่คำนวณจากจำนวนในตาราง แต่ละค่ามีช่วงความเชื่อมั่น 95% แบบ exact (Clopper-Pearson) ส่วน likelihood ratio เป็นอัตราส่วนของสัดส่วนสองค่า ช่วงความเชื่อมั่น 95% จึงใช้ log method คือคำนวณ standard error ของ log likelihood ratio จากจำนวนทั้งสี่เซลล์ แล้วแปลงขอบเขตกลับเป็นสเกลเดิม
| App screening result | Reference standard: pure-tone audiometry | Total | |
|---|---|---|---|
| Hearing loss | No hearing loss | ||
| Positive (score 52 or more) | 56 (TP) | 33 (FP) | 89 |
| Negative (score below 52) | 22 (FN) | 189 (TN) | 211 |
| Total | 78 | 222 | 300 |
- TP, true positive; FP, false positive; FN, false negative; TN, true negative.TP คือผลบวกจริง (true positive) FP คือผลบวกลวง (false positive) FN คือผลลบลวง (false negative) TN คือผลลบจริง (true negative)
| Measure | Estimate | 95% CI | Calculated as |
|---|---|---|---|
| Proportions, exact 95% CI | |||
| Prevalence in this sample | 26.0% | 21.1% to 31.4% | (TP + FN) / N |
| Sensitivity | 71.8% | 60.5% to 81.4% | TP / (TP + FN) |
| Specificity | 85.1% | 79.8% to 89.5% | TN / (TN + FP) |
| Positive predictive value (PPV)* | 62.9% | 52.0% to 72.9% | TP / (TP + FP) |
| Negative predictive value (NPV)* | 89.6% | 84.6% to 93.3% | TN / (TN + FN) |
| Likelihood ratios, log-method 95% CI | |||
| Positive likelihood ratio (LR+) | 4.83 | 3.42 to 6.81 | Sensitivity / (1 − specificity) |
| Negative likelihood ratio (LR−) | 0.33 | 0.23 to 0.47 | (1 − sensitivity) / specificity |
- * PPV and NPV depend on the prevalence of hearing loss in this sample (26.0%). In a group with a different prevalence they change, even when the sensitivity and specificity stay the same.* PPV และ NPV ขึ้นกับความชุกของภาวะการได้ยินบกพร่องในตัวอย่างนี้ (26.0%) ในกลุ่มที่มีความชุกต่างออกไป ค่าทั้งสองจะเปลี่ยนไปแม้ความไวและความจำเพาะจะเท่าเดิม
- Exact 95% CI: Clopper-Pearson. Log-method 95% CI: the standard error of the log likelihood ratio from the four counts, transformed back.Exact 95% CI คือช่วงความเชื่อมั่นแบบ Clopper-Pearson ส่วน log-method 95% CI คำนวณ standard error ของ log likelihood ratio จากจำนวนทั้งสี่เซลล์ แล้วแปลงกลับเป็นสเกลเดิม
- N, all participants. TP, FP, FN and TN as in the 2×2 table.N คือผู้เข้าร่วมทั้งหมด ส่วน TP FP FN และ TN มีความหมายเดียวกับในตาราง 2×2
How to read it: a sensitivity of 71.8% (95% CI 60.5% to 81.4%) means the app screen was positive in 56 of the 78 people with hearing loss; a specificity of 85.1% means it was negative in 189 of the 222 people without it. The predictive values read the other way, from the screen result: of the 89 people who screened positive, 62.9% had hearing loss. A positive likelihood ratio of 4.83 means a positive screen is 4.83 times as common in people with hearing loss as in people without it; a negative likelihood ratio of 0.33 means a negative screen is 0.33 times as common in people with hearing loss as in people without it.วิธีอ่าน: ความไว 71.8% (95% CI 60.5% ถึง 81.4%) หมายความว่าแอปให้ผลบวกใน 56 คน จากผู้มีภาวะการได้ยินบกพร่องทั้งหมด 78 คน ความจำเพาะ 85.1% หมายความว่าแอปให้ผลลบใน 189 คน จากผู้ไม่มีภาวะนี้ 222 คน ค่าพยากรณ์อ่านในทิศกลับกัน คือเริ่มจากผลคัดกรอง ในผู้ที่ผลคัดกรองเป็นบวก 89 คน มี 62.9% ที่มีภาวะการได้ยินบกพร่องจริง likelihood ratio ของผลบวกเท่ากับ 4.83 หมายความว่าผลคัดกรองบวกพบในผู้มีภาวะนี้เป็น 4.83 เท่าของที่พบในผู้ไม่มีภาวะ ส่วน likelihood ratio ของผลลบเท่ากับ 0.33 หมายความว่าผลคัดกรองลบพบในผู้มีภาวะนี้เป็น 0.33 เท่าของที่พบในผู้ไม่มีภาวะ
PPV and NPV depend on the prevalence. In this sample 26.0% of participants had hearing loss. The same sensitivity and specificity, applied by Bayes' rule to a group in which 10% have hearing loss, give a PPV of 34.9% and an NPV of 96.4%: the PPV falls and the NPV rises. Predictive values from one sample therefore do not carry over to a group with a different prevalence; sensitivity, specificity and likelihood ratios carry over better, although they too can change with the case mix.PPV และ NPV ขึ้นกับความชุก ในตัวอย่างนี้ผู้เข้าร่วม 26.0% มีภาวะการได้ยินบกพร่อง เมื่อนำความไวและความจำเพาะชุดเดิมไปคำนวณด้วยทฤษฎีบทของเบย์ (Bayes' rule) สำหรับกลุ่มที่มีความชุก 10% จะได้ PPV 34.9% และ NPV 96.4% คือ PPV ลดลงและ NPV สูงขึ้น ค่าพยากรณ์จากตัวอย่างหนึ่งจึงนำไปใช้กับกลุ่มที่มีความชุกต่างกันโดยตรงไม่ได้ ส่วนความไว ความจำเพาะ และ likelihood ratio นำไปใช้ต่อได้ดีกว่า แม้ค่าเหล่านี้ก็อาจเปลี่ยนได้ตามลักษณะของผู้ที่ได้รับการตรวจ (case mix)
Agreement between two raters: kappaความสอดคล้องระหว่างผู้ประเมินสองคน: kappa
Method. The observed agreement is the share of videos given the same grade by both physiotherapists. Cohen's kappa compares it with the agreement expected by chance from each rater's own mix of grades: kappa is the observed agreement minus the chance agreement, divided by one minus the chance agreement. Because the grades are ordered, a weighted kappa with quadratic weights is also given: a disagreement by one grade counts as a partial agreement, and the credit falls with the square of the distance between the grades. The 95% CIs use the large-sample (asymptotic) standard error of kappa.วิธีการ: ความสอดคล้องที่สังเกตได้ (observed agreement) คือสัดส่วนของวิดีโอที่นักกายภาพบำบัดทั้งสองคนให้เกรดตรงกัน Cohen's kappa นำค่านี้ไปเทียบกับความสอดคล้องที่คาดว่าจะเกิดขึ้นโดยบังเอิญ ซึ่งคำนวณจากสัดส่วนเกรดของผู้ประเมินแต่ละคน โดย kappa เท่ากับความสอดคล้องที่สังเกตได้ลบความสอดคล้องจากความบังเอิญ หารด้วยหนึ่งลบความสอดคล้องจากความบังเอิญ เนื่องจากเกรดเรียงลำดับได้ จึงรายงาน weighted kappa แบบถ่วงน้ำหนักกำลังสอง (quadratic weights) ด้วย กล่าวคือการให้เกรดต่างกันหนึ่งระดับนับเป็นความสอดคล้องบางส่วน และคะแนนที่ได้ลดลงตามกำลังสองของระยะห่างระหว่างเกรด ช่วงความเชื่อมั่น 95% ใช้ standard error สำหรับตัวอย่างขนาดใหญ่ (asymptotic standard error) ของ kappa
| Physiotherapist one | Physiotherapist two | Total | |||
|---|---|---|---|---|---|
| Excellent | Good | Fair | Poor | ||
| Excellent | 18 | 9 | 0 | 0 | 27 |
| Good | 11 | 9 | 9 | 0 | 29 |
| Fair | 3 | 11 | 25 | 3 | 42 |
| Poor | 0 | 1 | 8 | 13 | 22 |
| Total | 32 | 30 | 42 | 16 | 120 |
- Rows are the grades of physiotherapist one and columns those of physiotherapist two. The diagonal from top left to bottom right holds the videos given the same grade by both; the cells next to it are disagreements by one grade.แถวคือเกรดของนักกายภาพบำบัดคนที่หนึ่ง คอลัมน์คือเกรดของคนที่สอง แนวทแยงจากมุมซ้ายบนถึงมุมขวาล่างคือวิดีโอที่ทั้งสองคนให้เกรดตรงกัน ส่วนเซลล์ที่อยู่ติดแนวทแยงคือการให้เกรดต่างกันหนึ่งระดับ
| Statistic | Estimate | 95% CI |
|---|---|---|
| Videos graded by both | 120 | – |
| Observed agreement (same grade) | 54.2% | – |
| Agreement expected by chance | 26.7% | – |
| Cohen's kappa, unweighted | 0.37 | 0.25 to 0.50 |
| Weighted kappa, quadratic weights* | 0.74 | 0.66 to 0.82 |
- * Quadratic weights: full credit for the same grade and partial credit for different grades, falling with the square of the distance between them. With 4 grades, a one-grade disagreement gets 8/9 of full credit; linear weights would give it 2/3 and, on the same grades, a lower weighted kappa of 0.57 (95% CI 0.47 to 0.67).* น้ำหนักกำลังสอง: ให้คะแนนเต็มเมื่อเกรดตรงกัน และให้คะแนนบางส่วนเมื่อเกรดต่างกัน โดยคะแนนลดลงตามกำลังสองของระยะห่างระหว่างเกรด เมื่อมี 4 ระดับ การให้เกรดต่างกันหนึ่งระดับได้ 8/9 ของคะแนนเต็ม ส่วนน้ำหนักเชิงเส้น (linear weights) จะให้ 2/3 และเมื่อใช้กับเกรดชุดเดียวกันจะได้ weighted kappa ต่ำกว่า คือ 0.57 (95% CI 0.47 ถึง 0.67)
- 95% CI: kappa plus and minus the normal quantile times its large-sample standard error.95% CI: ค่า kappa บวกและลบด้วยควอนไทล์ของการแจกแจงปกติคูณ standard error สำหรับตัวอย่างขนาดใหญ่
- A dash (–) means no confidence interval is shown for that row.เครื่องหมาย – หมายถึงไม่ได้แสดงช่วงความเชื่อมั่นสำหรับแถวนั้น
How to read it: the two physiotherapists gave the same grade to 65 of the 120 videos, an observed agreement of 54.2%; from their mixes of grades alone, 26.7% agreement would be expected by chance. Cohen's kappa is 0.37 (95% CI 0.25 to 0.50). The weighted kappa is higher, 0.74 (95% CI 0.66 to 0.82), because 51 of the 55 disagreements were by one grade only, and the weighted kappa gives these near misses partial credit; its size also depends on the weights chosen (see the table footnote). Which kappa fits depends on whether a near miss matters for the purpose of the scale, a choice made before the analysis.วิธีอ่าน: นักกายภาพบำบัดทั้งสองคนให้เกรดตรงกัน 65 จาก 120 คลิป คิดเป็นความสอดคล้องที่สังเกตได้ 54.2% แต่หากดูจากสัดส่วนเกรดของแต่ละคนเพียงอย่างเดียว คาดว่าจะตรงกันโดยบังเอิญได้ 26.7% Cohen's kappa เท่ากับ 0.37 (95% CI 0.25 ถึง 0.50) ส่วน weighted kappa สูงกว่า คือ 0.74 (95% CI 0.66 ถึง 0.82) เพราะในความเห็นที่ไม่ตรงกัน 55 คลิป มีถึง 51 คลิปที่ต่างกันเพียงหนึ่งระดับ และ weighted kappa ให้คะแนนบางส่วนกับกรณีที่เกือบตรงกันเหล่านี้ ขนาดของ weighted kappa จึงขึ้นกับระบบน้ำหนักที่เลือกใช้ด้วย (ดูเชิงอรรถของตาราง) kappa แบบใดเหมาะกว่าขึ้นกับว่าการให้เกรดต่างกันหนึ่งระดับมีความสำคัญเพียงใดต่อวัตถุประสงค์ของมาตรวัด ซึ่งควรกำหนดไว้ก่อนการวิเคราะห์
Agreement between two measurement methods: ICC and Bland-Altmanความสอดคล้องระหว่างวิธีวัดสองวิธี: ICC และ Bland-Altman
Method. Each participant has two heart rates taken at the same moment. The ICC uses a two-way model for the absolute agreement of single measurements, written ICC(A,1): the two devices are the only devices of interest (a two-way mixed model), and the estimate and its 95% CI are the same under a two-way random model. The 95% CI is an approximate F interval whose degrees of freedom are estimated from the mean squares of the two-way analysis of variance. The Bland-Altman analysis works on the difference, wrist minus chest strap. The bias is the mean difference, with a 95% CI from the t distribution; the 95% limits of agreement are the bias plus and minus 1.96 standard deviations of the differences, and the 95% CI of each limit uses the approximate standard error of a limit: the SD of the differences times the square root of three divided by the number of participants. Each Bland-Altman number is computed step by step, so it can be checked by hand from the differences.วิธีการ: ผู้เข้าร่วมแต่ละคนมีค่าอัตราการเต้นของหัวใจสองค่าที่วัดในเวลาเดียวกัน ICC ใช้แบบจำลอง two-way สำหรับ absolute agreement ของการวัดครั้งเดียว (single measurement) เขียนเป็น ICC(A,1) โดยสนใจเฉพาะอุปกรณ์สองชิ้นนี้ ไม่ได้ถือเป็นตัวแทนของอุปกรณ์อื่น (two-way mixed model) ซึ่งค่าประมาณและ 95% CI จะได้ค่าเท่าเดิมหากใช้ two-way random model ช่วงความเชื่อมั่น 95% นี้คำนวณจากการแจกแจง F แบบประมาณ โดยองศาอิสระประมาณจาก mean square ของการวิเคราะห์ความแปรปรวนแบบสองทาง การวิเคราะห์แบบ Bland-Altman ใช้ผลต่าง คือค่าจากข้อมือลบค่าจากสายคาดอก bias คือค่าเฉลี่ยของผลต่าง พร้อม 95% CI จากการแจกแจง t ขอบเขตความสอดคล้อง 95% คือ bias บวกและลบ 1.96 เท่าของส่วนเบี่ยงเบนมาตรฐานของผลต่าง และ 95% CI ของแต่ละขอบเขตใช้ standard error โดยประมาณของขอบเขต คือ SD ของผลต่างคูณรากที่สองของสามหารด้วยจำนวนผู้เข้าร่วม ตัวเลขแบบ Bland-Altman ทุกค่าคำนวณทีละขั้น จึงตรวจสอบด้วยมือจากผลต่างได้
| Statistic | Estimate | 95% CI |
|---|---|---|
| Heart rate at the end of the step test, bpm | ||
| Chest-strap ECG monitor, mean (SD) | 115.9 (17.1) | – |
| Wrist-worn optical monitor, mean (SD) | 113.2 (18.1) | – |
| Bland-Altman: wrist minus chest strap, bpm | ||
| Mean difference (bias) | −2.6 | −3.3 to −1.9 |
| SD of the differences | 3.6 | – |
| Lower 95% limit of agreement | −9.6 | −10.8 to −8.4 |
| Upper 95% limit of agreement | 4.4 | 3.2 to 5.6 |
| Intraclass correlation coefficient | ||
| ICC(A,1): two-way, absolute agreement, single measurement | 0.97 | 0.89 to 0.99 |
- Differences are wrist minus chest strap, so a negative value means the wrist device read lower. Limits of agreement: the bias plus and minus 1.96 SD of the differences. The CI of the bias uses the t distribution; the CI of each limit uses the approximate standard error of a limit, the SD of the differences times the square root of three divided by the number of participants.ผลต่างคือค่าจากข้อมือลบค่าจากสายคาดอก ค่าติดลบจึงหมายความว่าอุปกรณ์ข้อมือวัดได้ต่ำกว่า ขอบเขตความสอดคล้องคือ bias บวกและลบ 1.96 เท่าของ SD ของผลต่าง ช่วงความเชื่อมั่นของ bias ใช้การแจกแจง t และช่วงความเชื่อมั่นของแต่ละขอบเขตใช้ standard error โดยประมาณของขอบเขต คือ SD ของผลต่างคูณรากที่สองของสามหารด้วยจำนวนผู้เข้าร่วม
- ICC(A,1): two-way model, absolute agreement, single measurement; 95% CI: approximate F interval, with degrees of freedom estimated from the mean squares. SD, standard deviation; bpm, beats per minute.ICC(A,1): แบบจำลอง two-way แบบ absolute agreement ของการวัดครั้งเดียว ช่วงความเชื่อมั่น 95% จากการแจกแจง F แบบประมาณ ซึ่งองศาอิสระประมาณจาก mean square ส่วน SD คือส่วนเบี่ยงเบนมาตรฐาน และ bpm คือครั้งต่อนาที
- A dash (–) means no confidence interval is shown for that row. Each number is rounded on its own, so the difference between the two rounded means can differ from the rounded bias in the last digit.เครื่องหมาย – หมายถึงไม่ได้แสดงช่วงความเชื่อมั่นสำหรับแถวนั้น ตัวเลขแต่ละค่าปัดเศษแยกกัน ผลต่างของค่าเฉลี่ยสองค่าหลังปัดเศษจึงอาจต่างจาก bias ที่ปัดเศษแล้วในหลักสุดท้าย
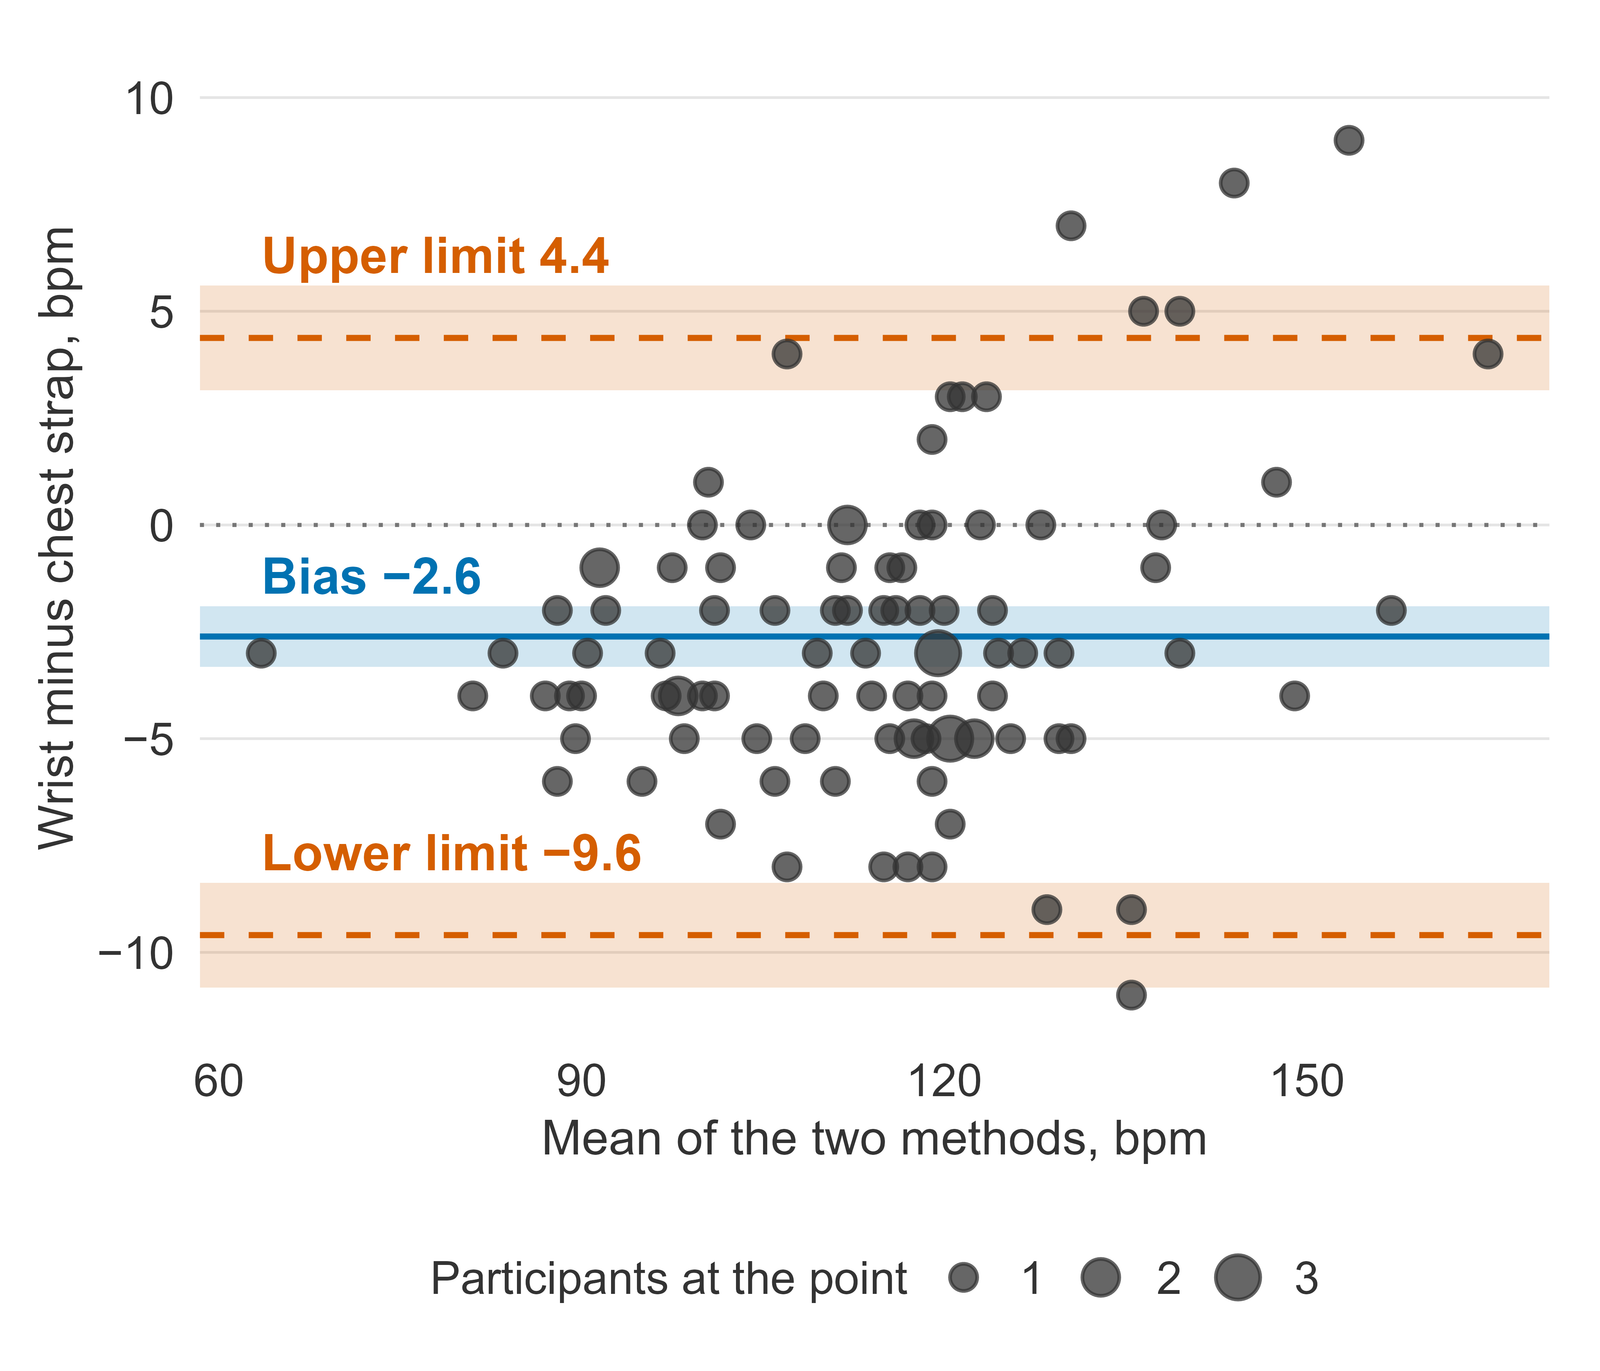
How to read it: each point is one participant, or several with identical readings. The bias of −2.6 bpm (95% CI −3.3 to −1.9) means the wrist device read lower than the chest strap on average, and the interval does not include zero. If the spread were the same at every heart rate, about 95% of differences would fall between the limits of agreement, −9.6 and 4.4 bpm; here it is not the same: the standard deviation of the differences is 2.3 bpm in the half of the participants with the lower mean heart rates and 4.4 bpm in the half with the higher ones.วิธีอ่าน: แต่ละจุดคือผู้เข้าร่วมหนึ่งคน หรือหลายคนที่มีค่าที่วัดได้เท่ากัน bias เท่ากับ −2.6 ครั้งต่อนาที (95% CI −3.3 ถึง −1.9) หมายความว่าโดยเฉลี่ยอุปกรณ์ข้อมือวัดได้ต่ำกว่าสายคาดอก และช่วงความเชื่อมั่นไม่ครอบคลุมศูนย์ หากการกระจายของผลต่างเท่ากันทุกระดับอัตราการเต้นของหัวใจ ผลต่างราว 95% จะอยู่ระหว่างขอบเขตความสอดคล้อง −9.6 ถึง 4.4 ครั้งต่อนาที แต่ในข้อมูลนี้การกระจายไม่เท่ากัน โดยส่วนเบี่ยงเบนมาตรฐานของผลต่างเท่ากับ 2.3 ครั้งต่อนาทีในครึ่งของผู้เข้าร่วมที่มีอัตราการเต้นเฉลี่ยต่ำกว่า และ 4.4 ครั้งต่อนาทีในครึ่งที่สูงกว่า
When the spread of the differences grows with the heart rate, one pair of limits is too wide at low heart rates and too narrow at high ones. Limits that change with the mean (regression-based limits of agreement) or an analysis on the log scale would describe data like these better.เมื่อการกระจายของผลต่างเพิ่มขึ้นตามอัตราการเต้นของหัวใจ ขอบเขตความสอดคล้องคู่เดียวจะกว้างเกินไปที่อัตราการเต้นต่ำ และแคบเกินไปที่อัตราการเต้นสูง การใช้ขอบเขตที่เปลี่ยนตามค่าเฉลี่ย (regression-based limits of agreement) หรือการวิเคราะห์บนสเกล log จะอธิบายข้อมูลลักษณะนี้ได้ดีกว่า
ICC and limits of agreement answer different questions. The ICC, 0.97 (95% CI 0.89 to 0.99), compares the disagreement between the methods with how much heart rates differ from one person to another; it is close to one here largely because the heart rates of the participants spread widely (SD 17.1 bpm on the chest strap). The limits of agreement say, in beats per minute, how far apart the two devices can read for one person. Tested on people with more similar heart rates, the same devices would usually give a lower ICC, even if they agreed just as closely.ICC และขอบเขตความสอดคล้องตอบคำถามต่างกัน ICC เท่ากับ 0.97 (95% CI 0.89 ถึง 0.99) เป็นการเทียบความไม่ตรงกันระหว่างสองวิธีวัดกับความแตกต่างของอัตราการเต้นของหัวใจระหว่างคน ค่า ICC ที่เข้าใกล้หนึ่งในที่นี้ส่วนใหญ่มาจากการที่อัตราการเต้นของหัวใจของผู้เข้าร่วมกระจายกว้าง (SD 17.1 ครั้งต่อนาทีจากสายคาดอก) ส่วนขอบเขตความสอดคล้องบอกเป็นหน่วยครั้งต่อนาทีว่าค่าจากสองอุปกรณ์อาจต่างกันได้มากเพียงใดในคนคนเดียว หากทดสอบอุปกรณ์คู่เดิมในกลุ่มคนที่อัตราการเต้นของหัวใจใกล้เคียงกันมากกว่านี้ ICC มักจะต่ำลง แม้อุปกรณ์ทั้งสองจะวัดได้ใกล้กันเท่าเดิม
What this sample does not show: no comparison of two index tests, no sample-size reasoning, no handling of indeterminate or missing test results, and no validation of the cut-off in new people. Whether this cut-off, these kappas or limits of agreement of this width are good enough is a clinical judgement. The acceptable limits should be set before the analysis, and what the results mean for practice is for the research team to interpret.สิ่งที่ตัวอย่างนี้ไม่ได้แสดง: ไม่มีการเปรียบเทียบการตรวจคัดกรองสองวิธี ไม่มีการคำนวณขนาดตัวอย่าง ไม่มีการจัดการผลตรวจที่สรุปไม่ได้หรือข้อมูลที่ขาดหาย และไม่มีการตรวจสอบจุดตัดในคนกลุ่มใหม่ การตัดสินว่าจุดตัดนี้ ค่า kappa เหล่านี้ หรือขอบเขตความสอดคล้องที่กว้างเท่านี้ดีพอหรือไม่ เป็นการตัดสินทางคลินิก ขอบเขตที่ยอมรับได้ควรกำหนดไว้ก่อนการวิเคราะห์ และความหมายของผลต่อการนำไปใช้ในทางปฏิบัติเป็นหน้าที่ของทีมวิจัยในการแปลผล
What you send and do yourselfสิ่งที่คุณต้องส่งและทำเอง
- What the index test and the reference standard are, and how each was measured.รายละเอียดว่าการทดสอบที่ศึกษาและมาตรฐานอ้างอิงคืออะไร และวัดอย่างไร
- A de-identified dataset with its codebook: no names, ID numbers, addresses or anything else that identifies a person.ชุดข้อมูลที่ตัดข้อมูลระบุตัวตนออกแล้ว พร้อมคู่มือรหัสตัวแปร (codebook) โดยไม่มีชื่อ เลขประจำตัว ที่อยู่ หรือข้อมูลอื่นที่ระบุตัวบุคคลได้
- You interpret the results and write your own article, and acknowledge the statistical help in the way your journal asks.คุณเป็นผู้แปลผลและเขียนบทความของคุณเอง และระบุความช่วยเหลือด้านสถิติตามรูปแบบที่วารสารกำหนด
Limitsขอบเขตและข้อจำกัด
- Statistical analysis and advice only: the research question, the data, the interpretation and the writing stay yours.บริการนี้เป็นงานวิเคราะห์และให้คำแนะนำทางสถิติเท่านั้น คำถามวิจัย ข้อมูล การแปลผล และการเขียน เป็นของคุณทั้งหมด
- The design of the accuracy study (who was tested, and how) is yours; I point out where the data limit what can be concluded.การออกแบบการศึกษา (ใครได้รับการทดสอบ และทดสอบอย่างไร) เป็นของคุณ ผมจะชี้ให้เห็นหากข้อมูลมีข้อจำกัดต่อการสรุปผล
- Not for a thesis, an independent study or other work submitted for a degree; for those, I offer consultation only.ไม่รับทำงานที่จะนำไปใช้เพื่อสำเร็จการศึกษา เช่น วิทยานิพนธ์ การค้นคว้าอิสระ หรือผลงานอื่นที่ยื่นเพื่อรับปริญญา งานลักษณะนี้รับเฉพาะการให้คำปรึกษา
- Authorship is not sold and is not a condition of the service.การมีชื่อเป็นผู้นิพนธ์ไม่ใช่สิ่งที่ซื้อขายได้ และไม่ใช่เงื่อนไขในการรับงาน
Request this serviceขอใช้บริการนี้
Every request is reviewed first. I may accept or decline it. The timeline is agreed per project after review.ผมพิจารณาคำขอทุกงานก่อน และอาจรับหรือปฏิเสธงาน ระยะเวลาของแต่ละงานตกลงกันหลังพิจารณาคำขอแล้ว
Member prices apply only to orders that start on uniqcret.com; if you found me on Fastwork or your enquiry began there, please order on Fastwork at the Fastwork price.ราคาสมาชิกใช้กับงานที่เริ่มต้นบน uniqcret.com เท่านั้น หากคุณรู้จักผมจาก Fastwork หรือเริ่มสอบถามบน Fastwork กรุณาสั่งงานบน Fastwork ในราคาของ Fastwork