Descriptive tables and group comparisonsตารางเชิงพรรณนาและการเปรียบเทียบระหว่างกลุ่ม
Descriptive tables (Table 1) and group comparisons, with normality checksตารางสถิติเชิงพรรณนา (ตาราง 1) และการเปรียบเทียบระหว่างกลุ่ม พร้อมการตรวจสอบการแจกแจงแบบปกติ
An invented logistics company runs an annual workplace health check. This sample describes 240 staff in two groups of unequal size: 148 who work fixed day shifts and 92 who work rotating shifts. The groups are observational: nobody was randomised to a shift pattern. The record holds age, systolic blood pressure, waist circumference, fasting triglycerides, gamma-glutamyl transferase (GGT), weekly physical activity, sex, smoking, the main way of travelling to work and a self-rated sleep quality; 4 variables have missing values (2.5% to 7.5% of staff). The company, the staff and every value are invented: all data are simulated with a fixed seed.บริษัทขนส่งสมมุติแห่งหนึ่งจัดตรวจสุขภาพพนักงานประจำปี ตัวอย่างนี้บรรยายข้อมูลพนักงาน 240 คน ในสองกลุ่มที่มีขนาดไม่เท่ากัน คือพนักงานที่ทำงานกะกลางวันประจำ 148 คน และพนักงานที่ทำงานหมุนเวียนกะ 92 คน การแบ่งกลุ่มเป็นไปตามกะที่พนักงานทำอยู่จริง (การศึกษาเชิงสังเกต หรือ observational study) ไม่มีการสุ่มพนักงานเข้ากะทำงาน ข้อมูลประกอบด้วยอายุ ความดันโลหิตซิสโตลิก เส้นรอบเอว ไตรกลีเซอไรด์ขณะอดอาหาร แกมมา-กลูตามิลทรานสเฟอเรส (GGT) ระยะเวลาการมีกิจกรรมทางกายต่อสัปดาห์ เพศ การสูบบุหรี่ วิธีหลักในการเดินทางมาทำงาน และคุณภาพการนอนที่ประเมินด้วยตนเอง มีตัวแปร 4 ตัวที่มีข้อมูลขาดหาย (2.5% ถึง 7.5% ของพนักงาน) บริษัท พนักงาน และค่าทุกค่าเป็นเรื่องสมมุติ ข้อมูลทั้งหมดเป็นข้อมูลจำลองที่สร้างด้วย seed คงที่
What you receiveสิ่งที่คุณจะได้รับ
Table 1 for your study population: each variable is checked for its distribution, summarised the right way and compared between groups with a test that suits it.จัดทำตาราง 1 (Table 1) ที่บรรยายลักษณะของกลุ่มตัวอย่าง โดยตรวจการแจกแจงของตัวแปรทีละตัว เลือกค่าสรุปให้เหมาะ และเปรียบเทียบระหว่างกลุ่มด้วยสถิติทดสอบที่เข้ากับลักษณะข้อมูล
- Normality checks for every continuous variable, with the rule used to report mean (SD) or median (IQR).ผลการตรวจการแจกแจงแบบปกติของตัวแปรต่อเนื่องทุกตัว พร้อมเกณฑ์ที่ใช้ตัดสินว่าจะรายงานค่าเฉลี่ย (SD) หรือมัธยฐาน (IQR)
- Table 1 as an editable Word or Excel table, with the test used for each comparison named in a footnote.ตาราง 1 ในไฟล์ Word หรือ Excel ที่แก้ไขได้ ระบุสถิติทดสอบของแต่ละตัวแปรไว้ในเชิงอรรถ
- A short record of the statistical methods used, so you can describe them accurately in your own words.บันทึกสั้น ๆ ของวิธีการทางสถิติที่ใช้ เพื่อให้คุณนำไปเขียนอธิบายด้วยถ้อยคำของคุณเองได้อย่างถูกต้อง
The sampleตัวอย่างงาน
Sample work on simulated data. No real patient, no client project.ตัวอย่างงานจากข้อมูลจำลองทั้งหมด ไม่ใช่ข้อมูลผู้ป่วยจริง และไม่ใช่งานของลูกค้ารายใด
What this sample containsสิ่งที่อยู่ในตัวอย่างนี้
- Normality checks of every continuous variable within each group, with the decision rule stated before the tables: a table of Shapiro-Wilk results and skewness, histograms with Q-Q plots for one variable of each kind, and Q-Q plots of all 6 variables.การตรวจสอบการแจกแจงแบบปกติของตัวแปรต่อเนื่องทุกตัวในแต่ละกลุ่ม พร้อมเกณฑ์การตัดสินที่ระบุไว้ก่อนสร้างตาราง ได้แก่ ตารางผลการทดสอบ Shapiro-Wilk และค่าความเบ้ (skewness) ฮิสโทแกรมคู่กับ Q-Q plot ของตัวแปรแต่ละแบบอย่างละหนึ่งตัว และ Q-Q plot ของตัวแปรทั้ง 6 ตัว
- Table 1 by group, with the missing count of every variable and the test named on every row, followed by a methods paragraph to adapt for a manuscript.ตาราง 1 แยกตามกลุ่ม แสดงจำนวนข้อมูลที่ขาดหายของทุกตัวแปรและระบุสถิติทดสอบที่ใช้ในทุกแถว ตามด้วยย่อหน้าวิธีการทางสถิติสำหรับนำไปปรับใช้ในต้นฉบับบทความ
Normality checks and the decision ruleการตรวจสอบการแจกแจงแบบปกติและเกณฑ์การตัดสินใจ
The rule was fixed before Table 1 was built: use the shape of the distribution and the test together, never one alone. Within each group, every continuous variable was checked with a normal Q-Q plot, the sample skewness and the Shapiro-Wilk test. The skewness is the number that records the asymmetry a histogram or Q-Q plot shows, so the decision does not depend on how one reader sees a plot. A variable was treated as skewed when, in at least one group, its absolute skewness was above 0.5 and the Shapiro-Wilk P value was below 0.05. With groups of this size the test can flag departures too small to matter, so the test never decides alone.เกณฑ์นี้กำหนดไว้ก่อนสร้างตาราง 1 คือพิจารณารูปทรงการแจกแจงร่วมกับผลการทดสอบเสมอ ไม่ใช้อย่างใดอย่างหนึ่งเพียงลำพัง ตัวแปรต่อเนื่องทุกตัวในแต่ละกลุ่มได้รับการตรวจด้วย normal Q-Q plot ค่าความเบ้ของตัวอย่าง (sample skewness) และการทดสอบ Shapiro-Wilk ค่าความเบ้เป็นตัวเลขแทนความไม่สมมาตรที่เห็นได้ในฮิสโทแกรมหรือ Q-Q plot การตัดสินจึงไม่ขึ้นกับว่าผู้อ่านแต่ละคนมองกราฟอย่างไร ถือว่าตัวแปรมีการแจกแจงเบ้เมื่ออย่างน้อยหนึ่งกลุ่มมีค่าสัมบูรณ์ของความเบ้มากกว่า 0.5 และค่า P ของ Shapiro-Wilk น้อยกว่า 0.05 เมื่อกลุ่มมีขนาดเท่านี้ การทดสอบอาจให้ผลมีนัยสำคัญแม้การเบี่ยงเบนจากการแจกแจงปกติจะเล็กน้อยจนไม่มีผลในทางปฏิบัติ จึงไม่ใช้ผลการทดสอบเพียงอย่างเดียวในการตัดสิน
Result of the rule: of the 6 continuous variables, 3 were treated as skewed: triglycerides, GGT and weekly physical activity. They are summarised as median (IQR) and compared with the Wilcoxon rank-sum test. Age, systolic blood pressure and waist circumference were treated as normal: mean (SD) and Welch's t-test.ผลตามเกณฑ์: จากตัวแปรต่อเนื่อง 6 ตัว มี 3 ตัวที่ถือว่ามีการแจกแจงเบ้ ได้แก่ ไตรกลีเซอไรด์ GGT และกิจกรรมทางกายต่อสัปดาห์ ตัวแปรกลุ่มนี้นำเสนอด้วยมัธยฐาน (IQR) และเปรียบเทียบด้วย Wilcoxon rank-sum test ส่วนอายุ ความดันโลหิตซิสโตลิก และเส้นรอบเอว ถือว่ามีการแจกแจงแบบปกติ จึงนำเสนอด้วยค่าเฉลี่ย (SD) และเปรียบเทียบด้วย Welch's t-test
| Group | n | Shapiro-Wilk W | P value | Skewness |
|---|---|---|---|---|
| Age, years: treated as normal, mean (SD), Welch t-test | ||||
| Day shift | 148 | 0.983 | 0.073 | 0.21 |
| Rotating shift | 92 | 0.978 | 0.126 | −0.39 |
| Systolic blood pressure, mmHg: treated as normal, mean (SD), Welch t-test | ||||
| Day shift | 148 | 0.985 | 0.120 | −0.15 |
| Rotating shift | 92 | 0.989 | 0.607 | 0.21 |
| Waist circumference, cm: treated as normal, mean (SD), Welch t-test | ||||
| Day shift | 145 | 0.986 | 0.167 | −0.24 |
| Rotating shift | 89 | 0.987 | 0.549 | 0.18 |
| Triglycerides, mg/dL: treated as skewed, median (IQR), Wilcoxon rank-sum test | ||||
| Day shift | 139 | 0.853 | <0.001 | 1.98 |
| Rotating shift | 83 | 0.853 | <0.001 | 1.76 |
| Gamma-glutamyl transferase (GGT), U/L: treated as skewed, median (IQR), Wilcoxon rank-sum test | ||||
| Day shift | 148 | 0.866 | <0.001 | 1.70 |
| Rotating shift | 92 | 0.674 | <0.001 | 4.12 |
| Physical activity, minutes per week: treated as skewed, median (IQR), Wilcoxon rank-sum test | ||||
| Day shift | 143 | 0.881 | <0.001 | 1.41 |
| Rotating shift | 85 | 0.897 | <0.001 | 1.34 |
- W is the Shapiro-Wilk statistic: a lower W means a larger departure from a normal shape. Skewness is the sample skewness: a positive value means a longer right tail.W คือค่าสถิติ Shapiro-Wilk ค่า W ที่ต่ำลงหมายถึงรูปการแจกแจงที่เบี่ยงจากการแจกแจงปกติมากขึ้น ค่าความเบ้ (skewness) คือค่าความเบ้ของตัวอย่าง ค่าบวกหมายถึงหางขวายาวกว่าหางซ้าย
- Missing values are left out, so n can be smaller than the group size. The heading of each variable gives the decision and the summary used in Table 1.ไม่นับค่าที่ขาดหาย จำนวน n จึงอาจน้อยกว่าขนาดของกลุ่ม หัวข้อของแต่ละตัวแปรระบุผลการตัดสินและค่าสถิติที่ใช้ในตาราง 1
How to read it: each variable has one row per group. Systolic blood pressure in the day-shift group, for example, has W = 0.985 and skewness −0.15, while triglycerides in the rotating-shift group have W = 0.853 and skewness 1.76, a long right tail.วิธีอ่าน: แต่ละตัวแปรมีหนึ่งแถวต่อกลุ่ม ตัวอย่างเช่น ความดันโลหิตซิสโตลิกในกลุ่มกะกลางวันมีค่า W = 0.985 และค่าความเบ้ −0.15 ส่วนไตรกลีเซอไรด์ในกลุ่มหมุนเวียนกะมีค่า W = 0.853 และค่าความเบ้ 1.76 ซึ่งแสดงถึงหางขวาที่ยาว
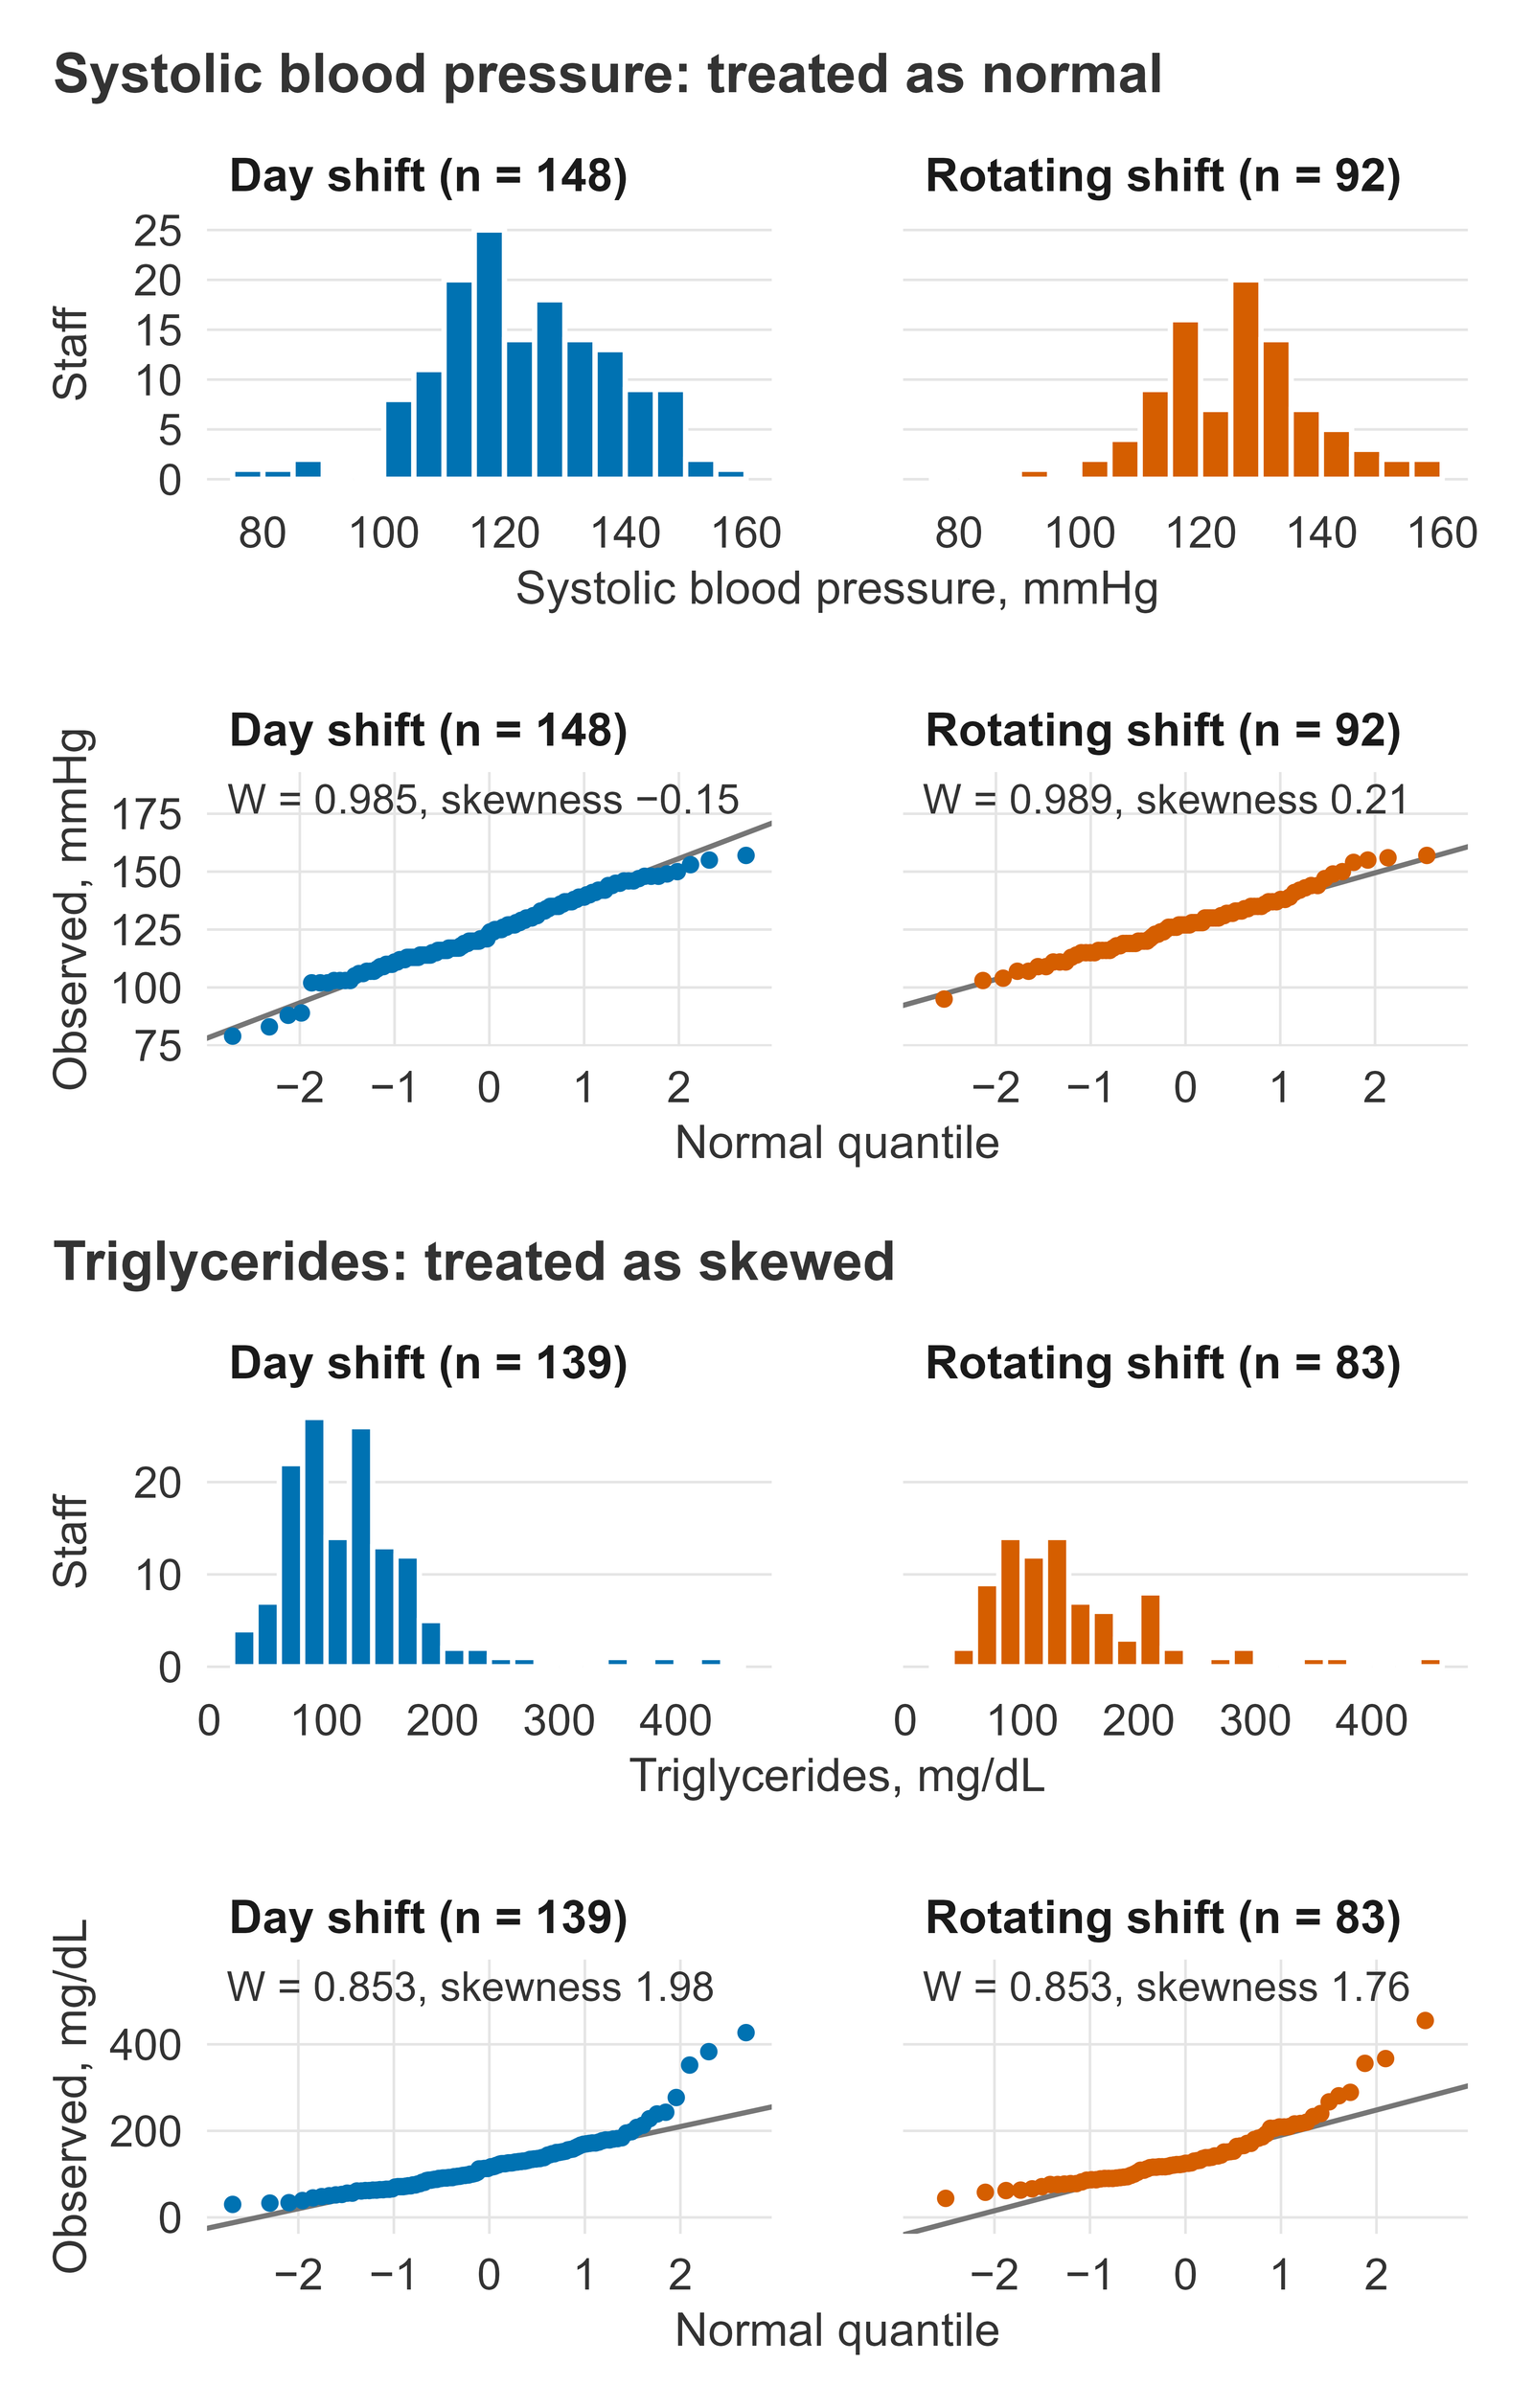
How to read it: on a normal Q-Q plot, points that lie along the grey line mean a shape close to normal. For triglycerides the points bend upward above the line at the right end: the largest values are larger than a normal distribution would give, which is the long right tail seen in the histogram. A few points off the line at either end are common even in normal data, which is why the plot and the test are read together.วิธีอ่าน: ใน normal Q-Q plot ถ้าจุดเรียงตัวตามเส้นสีเทา แสดงว่ารูปการแจกแจงใกล้เคียงการแจกแจงปกติ สำหรับไตรกลีเซอไรด์ จุดโค้งขึ้นเหนือเส้นที่ปลายด้านขวา หมายความว่าค่าที่สูงที่สุดสูงกว่าที่การแจกแจงปกติจะให้ ซึ่งก็คือหางขวาที่ยาวที่เห็นในฮิสโทแกรม การมีจุดไม่กี่จุดออกนอกเส้นที่ปลายทั้งสองด้านพบได้บ่อยแม้ในข้อมูลที่แจกแจงปกติ จึงต้องอ่านกราฟร่วมกับผลการทดสอบ
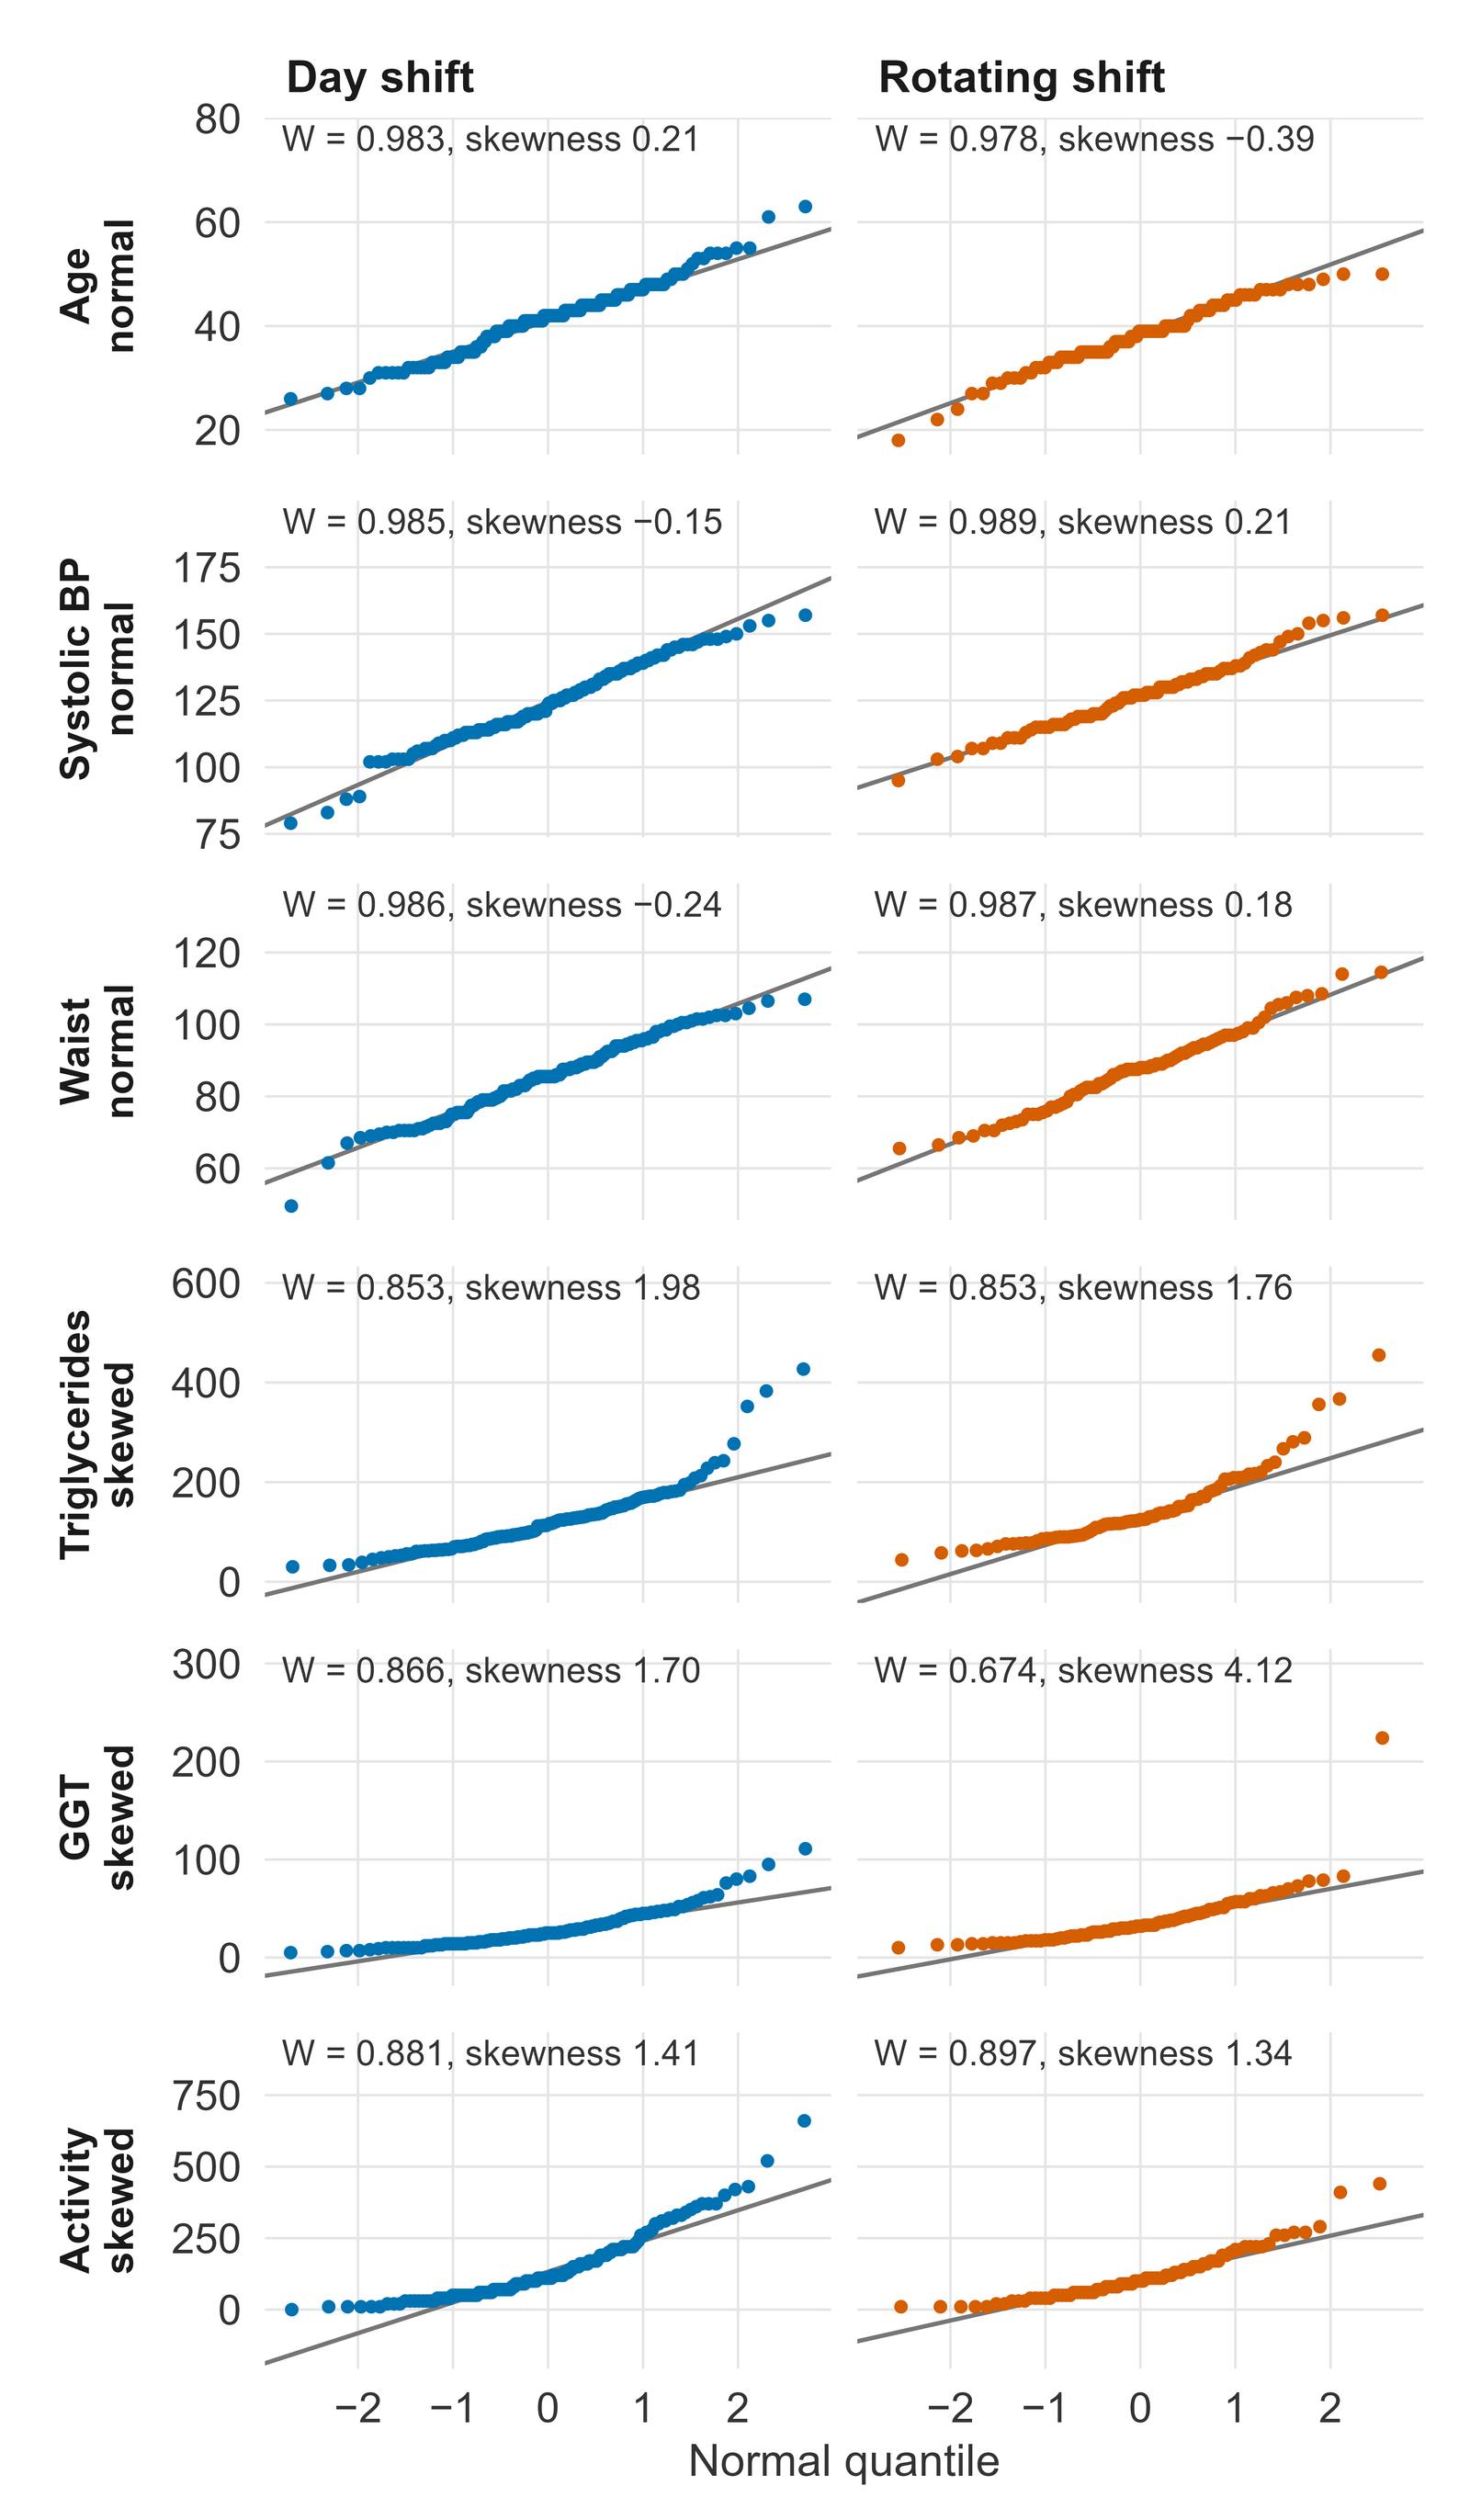
Table 1ตาราง 1
Why this Table 1 shows P values. In a randomised trial the baseline table should not show P values: any difference at baseline arises by chance through randomisation, so testing it answers no useful question. The two groups here are observational. A P value is the probability of seeing a difference at least this large if the two groups did not truly differ. Even in observational studies, reporting guidelines advise caution with tests in a descriptive table, and P values should not be used to choose which variables to adjust for. A P value is not a check of randomisation, not the size of the difference, and does not show that the shift pattern causes any difference.เหตุผลที่ตาราง 1 นี้แสดงค่า P ในการทดลองแบบสุ่ม (randomised trial) ตารางลักษณะพื้นฐานของกลุ่มตัวอย่าง (baseline table) ไม่ควรแสดงค่า P เพราะความแตกต่างที่พบตอนเริ่มต้นเกิดจากความบังเอิญของการสุ่มอยู่แล้ว การทดสอบจึงไม่ได้ตอบคำถามที่มีประโยชน์ สองกลุ่มในตัวอย่างนี้เป็นกลุ่มจากการศึกษาเชิงสังเกต ค่า P คือความน่าจะเป็นที่จะพบความแตกต่างมากเท่านี้หรือมากกว่า หากสองกลุ่มไม่ได้แตกต่างกันจริง แม้ในการศึกษาเชิงสังเกต แนวทางการรายงานผลการวิจัยก็แนะนำให้ระมัดระวังการใช้การทดสอบในตารางเชิงพรรณนา และไม่ควรใช้ค่า P เพื่อเลือกตัวแปรที่จะนำไปปรับในการวิเคราะห์ ค่า P ไม่ใช่การตรวจสอบการสุ่ม ไม่ใช่ขนาดของความแตกต่าง และไม่ได้แสดงว่ารูปแบบกะทำงานเป็นสาเหตุของความแตกต่างใด ๆ
| Characteristic | Day shift (n = 148) | Rotating shift (n = 92) | Missing, n | P value |
|---|---|---|---|---|
| Age, years, mean (SD) | 41.4 (6.6) | 38.2 (6.4) | 0 | <0.001† |
| Systolic blood pressure, mmHg, mean (SD) | 123.9 (14.6) | 126.9 (12.4) | 0 | 0.085† |
| Waist circumference, cm, mean (SD) | 85.4 (10.1) | 87.7 (10.7) | 6 | 0.103† |
| Triglycerides, mg/dL, median (IQR) | 115 (83 to 147) | 125 (92 to 171) | 18 | 0.018‡ |
| Gamma-glutamyl transferase (GGT), U/L, median (IQR) | 25 (16 to 36) | 32 (22 to 46) | 0 | <0.001‡ |
| Physical activity, minutes per week, median (IQR) | 110 (60 to 205) | 100 (60 to 160) | 12 | 0.179‡ |
| Female, n (%) | 63 (42.6) | 38 (41.3) | 0 | 0.847§ |
| Current smoker, n (%) | 25 (16.9) | 21 (22.8) | 0 | 0.256§ |
| Travel to work, n (%) | 0 | 0.106¶ | ||
| Car | 62 (41.9) | 30 (32.6) | ||
| Motorcycle | 46 (31.1) | 39 (42.4) | ||
| Shuttle bus | 32 (21.6) | 22 (23.9) | ||
| Walk or bicycle | 8 (5.4) | 1 (1.1) | ||
| Sleep quality, n (%) | 7 | 0.002‡ | ||
| Very good | 32 (22.1) | 8 (9.1) | ||
| Good | 56 (38.6) | 33 (37.5) | ||
| Fair | 44 (30.3) | 28 (31.8) | ||
| Poor | 13 (9.0) | 19 (21.6) |
- † Welch two-sample t-test.† การทดสอบ Welch two-sample t-test
- ‡ Wilcoxon rank-sum test; for sleep quality, on the ordered categories.‡ Wilcoxon rank-sum test (สำหรับคุณภาพการนอน ทดสอบตามลำดับของหมวดหมู่)
- § Pearson chi-square test without continuity correction.§ Pearson's chi-square test โดยไม่ใช้ continuity correction
- ¶ Fisher's exact test, used because an expected cell count was below 5.¶ Fisher's exact test ใช้เนื่องจากมีเซลล์ที่ค่าความถี่คาดหวัง (expected count) น้อยกว่า 5
- SD, standard deviation. IQR, interquartile range, shown as the lower to the upper quartile.SD คือส่วนเบี่ยงเบนมาตรฐาน IQR คือพิสัยระหว่างควอร์ไทล์ แสดงเป็นควอร์ไทล์ล่างถึงควอร์ไทล์บน
- Percentages use the staff with a recorded answer in each group. Missing gives the number of staff without a value, both groups together.ร้อยละคำนวณจากพนักงานที่มีข้อมูลในแต่ละกลุ่ม คอลัมน์ Missing แสดงจำนวนพนักงานที่ไม่มีข้อมูล รวมทั้งสองกลุ่ม
How to read it: read each row across the two groups. Systolic blood pressure is summarised as mean (SD): 123.9 mmHg (SD 14.6) in the day-shift group and 126.9 mmHg (SD 12.4) in the rotating-shift group, and the dagger after its P value names Welch's t-test. Travel to work has a rare category, walk or bicycle: its smallest expected count was 3.5, below 5, so Fisher's exact test replaced the chi-square test. The Missing column counts the staff without a value; each summary uses the staff with a value.วิธีอ่าน: อ่านแต่ละแถวเทียบระหว่างสองกลุ่ม ความดันโลหิตซิสโตลิกนำเสนอเป็นค่าเฉลี่ย (SD) คือ 123.9 mmHg (SD 14.6) ในกลุ่มกะกลางวัน และ 126.9 mmHg (SD 12.4) ในกลุ่มหมุนเวียนกะ เครื่องหมาย † หลังค่า P บอกว่าใช้ Welch's t-test ตัวแปรวิธีเดินทางมาทำงานมีหมวดที่พบน้อยคือเดินหรือปั่นจักรยาน ค่าความถี่คาดหวังที่น้อยที่สุดเท่ากับ 3.5 ซึ่งน้อยกว่า 5 จึงใช้ Fisher's exact test แทน chi-square test คอลัมน์ Missing นับจำนวนพนักงานที่ไม่มีข้อมูล และค่าสรุปแต่ละค่าคำนวณจากพนักงานที่มีข้อมูล
Methods paragraph for a manuscriptย่อหน้าวิธีการทางสถิติสำหรับต้นฉบับบทความ
Statistical analysis. Continuous variables were checked for normality within each group with normal Q-Q plots, the sample skewness and the Shapiro-Wilk test. A variable was treated as skewed when, in at least one group, its absolute skewness was above 0.5 and the Shapiro-Wilk P value was below 0.05. Normally distributed variables are presented as mean (SD) and compared with Welch's t-test; skewed variables are presented as median (IQR) and compared with the Wilcoxon rank-sum test, using the normal approximation with continuity correction. Categorical variables are presented as n (%) and compared with Pearson's chi-square test without continuity correction, or with Fisher's exact test when an expected cell count was below 5. Self-rated sleep quality, an ordinal variable, was compared with the Wilcoxon rank-sum test on its ordered categories. Missing values were not imputed: each summary uses the staff with a recorded value, and the number missing is shown for every variable. All tests were two-sided. Analyses were done in R version 4.6.1.การวิเคราะห์ทางสถิติ ตรวจสอบการแจกแจงแบบปกติของตัวแปรต่อเนื่องในแต่ละกลุ่มด้วย normal Q-Q plot ค่าความเบ้ของตัวอย่าง (sample skewness) และการทดสอบ Shapiro-Wilk ถือว่าตัวแปรมีการแจกแจงเบ้เมื่ออย่างน้อยหนึ่งกลุ่มมีค่าสัมบูรณ์ของความเบ้มากกว่า 0.5 และค่า P จากการทดสอบ Shapiro-Wilk น้อยกว่า 0.05 ตัวแปรที่มีการแจกแจงแบบปกตินำเสนอด้วยค่าเฉลี่ย (ส่วนเบี่ยงเบนมาตรฐาน) และเปรียบเทียบด้วย Welch's t-test ตัวแปรที่มีการแจกแจงเบ้นำเสนอด้วยมัธยฐาน (พิสัยระหว่างควอร์ไทล์) และเปรียบเทียบด้วย Wilcoxon rank-sum test โดยใช้การประมาณด้วยการแจกแจงปกติพร้อม continuity correction ตัวแปรเชิงกลุ่ม (categorical) นำเสนอด้วยจำนวน (ร้อยละ) และเปรียบเทียบด้วย Pearson's chi-square test โดยไม่ใช้ continuity correction หรือใช้ Fisher's exact test เมื่อมีเซลล์ที่ค่าความถี่คาดหวังน้อยกว่า 5 คุณภาพการนอนที่ประเมินด้วยตนเองเป็นตัวแปรเชิงอันดับ (ordinal) จึงเปรียบเทียบด้วย Wilcoxon rank-sum test ตามลำดับของหมวดหมู่ ไม่มีการทดแทนค่าข้อมูลที่ขาดหาย (imputation) ค่าสรุปแต่ละค่าคำนวณจากพนักงานที่มีข้อมูล และแสดงจำนวนข้อมูลที่ขาดหายของทุกตัวแปร การทดสอบทั้งหมดเป็นแบบสองทาง (two-sided) วิเคราะห์ด้วยโปรแกรม R เวอร์ชัน 4.6.1
What this sample does not show: no adjusted comparison, no effect sizes with confidence intervals and no correction for multiple testing. Table 1 describes the two groups; it does not explain why they differ. What any difference means for the staff, and what to do about it, is for the research team to interpret.สิ่งที่ตัวอย่างนี้ไม่ได้แสดง: ไม่มีการเปรียบเทียบที่ปรับอิทธิพลของตัวแปรอื่น ไม่มีขนาดอิทธิพล (effect size) พร้อมช่วงความเชื่อมั่น และไม่มีการปรับแก้สำหรับการทดสอบหลายครั้ง (multiple testing) ตาราง 1 บรรยายลักษณะของสองกลุ่ม แต่ไม่ได้อธิบายว่าทำไมจึงต่างกัน การแปลความหมายของความแตกต่างที่พบต่อพนักงาน และการตัดสินใจว่าควรทำอะไรต่อ เป็นหน้าที่ของทีมวิจัย
What you send and do yourselfสิ่งที่คุณต้องส่งและทำเอง
- Your research question, the grouping variable and the list of variables to describe.คำถามวิจัย ตัวแปรที่ใช้แบ่งกลุ่ม และรายการตัวแปรที่ต้องการนำเสนอ
- A de-identified dataset with its codebook: no names, ID numbers, addresses or anything else that identifies a person.ชุดข้อมูลที่ตัดข้อมูลระบุตัวตนออกแล้ว พร้อมคู่มือรหัสตัวแปร (codebook) โดยไม่มีชื่อ เลขประจำตัว ที่อยู่ หรือข้อมูลอื่นที่ระบุตัวบุคคลได้
- You interpret the results and write your own article, and acknowledge the statistical help in the way your journal asks.คุณเป็นผู้แปลผลและเขียนบทความของคุณเอง และระบุความช่วยเหลือด้านสถิติตามรูปแบบที่วารสารกำหนด
Limitsขอบเขตและข้อจำกัด
- Statistical analysis and advice only: the research question, the data, the interpretation and the writing stay yours.บริการนี้เป็นงานวิเคราะห์และให้คำแนะนำทางสถิติเท่านั้น คำถามวิจัย ข้อมูล การแปลผล และการเขียน เป็นของคุณทั้งหมด
- Not for a thesis, an independent study or other work submitted for a degree; for those, I offer consultation only.ไม่รับทำงานที่จะนำไปใช้เพื่อสำเร็จการศึกษา เช่น วิทยานิพนธ์ การค้นคว้าอิสระ หรือผลงานอื่นที่ยื่นเพื่อรับปริญญา งานลักษณะนี้รับเฉพาะการให้คำปรึกษา
- Authorship is not sold and is not a condition of the service.การมีชื่อเป็นผู้นิพนธ์ไม่ใช่สิ่งที่ซื้อขายได้ และไม่ใช่เงื่อนไขในการรับงาน
Request this serviceขอใช้บริการนี้
Every request is reviewed first. I may accept or decline it. The timeline is agreed per project after review.ผมพิจารณาคำขอทุกงานก่อน และอาจรับหรือปฏิเสธงาน ระยะเวลาของแต่ละงานตกลงกันหลังพิจารณาคำขอแล้ว
Member prices apply only to orders that start on uniqcret.com; if you found me on Fastwork or your enquiry began there, please order on Fastwork at the Fastwork price.ราคาสมาชิกใช้กับงานที่เริ่มต้นบน uniqcret.com เท่านั้น หากคุณรู้จักผมจาก Fastwork หรือเริ่มสอบถามบน Fastwork กรุณาสั่งงานบน Fastwork ในราคาของ Fastwork