Study design and statistical analysis planการออกแบบการศึกษาและแผนการวิเคราะห์ทางสถิติ
Statistical analysis plan for a two-arm exercise trialแผนการวิเคราะห์ทางสถิติสำหรับการทดลองแบบสุ่มสองกลุ่มของโปรแกรมออกกำลังกาย
An invented community health centre plans a randomised trial for older adults who live at home. One arm is invited to a supervised group exercise programme for leg strength and balance, 2 sessions a week for 12 weeks; the other arm receives a printed home-exercise leaflet, the centre's usual advice. The research team has already set the question and the primary endpoint: the 30-second chair-stand count, the number of times a person stands up fully from a chair and sits down again in that time, at week 12. This sample is the statistical part of the plan that a statistician writes for such a team before the first participant is enrolled, so it holds no outcome data. The centre, the trial and every number are invented; the only data are simulated trials, drawn with a fixed seed, that check the sample size.ศูนย์สุขภาพชุมชนสมมุติแห่งหนึ่งวางแผนทำการทดลองแบบสุ่มในผู้สูงอายุที่อาศัยอยู่ที่บ้าน กลุ่มหนึ่งได้รับเชิญเข้าร่วมโปรแกรมออกกำลังกายแบบกลุ่มภายใต้การดูแลของผู้ฝึก เพื่อเสริมกำลังกล้ามเนื้อขาและการทรงตัว สัปดาห์ละ 2 ครั้ง นาน 12 สัปดาห์ อีกกลุ่มได้รับแผ่นพับท่าออกกำลังกายที่บ้าน ซึ่งเป็นคำแนะนำตามปกติของศูนย์ ทีมวิจัยกำหนดคำถามวิจัยและตัวชี้วัดผลลัพธ์หลักไว้แล้ว คือจำนวนครั้งที่ลุกยืนจากเก้าอี้ได้ใน 30 วินาที (ลุกขึ้นยืนเต็มที่แล้วนั่งลงนับเป็นหนึ่งครั้ง) ที่สัปดาห์ที่ 12 ตัวอย่างนี้คือส่วนสถิติของแผนที่นักสถิติจัดทำให้ทีมวิจัยก่อนรับผู้เข้าร่วมรายแรก จึงไม่มีข้อมูลผลลัพธ์ใด ๆ ศูนย์สุขภาพ การทดลอง และตัวเลขทุกตัวเป็นเรื่องสมมุติ ข้อมูลเพียงอย่างเดียวในตัวอย่างนี้คือการทดลองจำลองที่สร้างด้วย seed คงที่ เพื่อใช้ตรวจสอบขนาดตัวอย่าง
What you receiveสิ่งที่คุณจะได้รับ
Advice on your study design and a written statistical analysis plan for your protocol. This covers the statistical part only.ให้คำปรึกษาด้านการออกแบบการศึกษา และจัดทำแผนการวิเคราะห์ทางสถิติสำหรับโครงร่างวิจัยของคุณ เฉพาะส่วนสถิติเท่านั้น
- The estimand, the primary and secondary endpoints, and the analysis populations.estimand (สิ่งที่การศึกษาต้องการประมาณค่า) ผลลัพธ์หลักและผลลัพธ์รอง และประชากรที่ใช้ในการวิเคราะห์
- The model for each endpoint and how missing data will be handled.แบบจำลองสำหรับผลลัพธ์แต่ละตัว และแนวทางจัดการข้อมูลที่ขาดหาย
- Sensitivity analyses, and empty table shells for the results.การวิเคราะห์ความไว (sensitivity analysis) และโครงตารางเปล่าสำหรับใส่ผลการวิเคราะห์
- A consultation to go through the plan with you.นัดปรึกษาเพื่อทบทวนแผนไปด้วยกัน
The sampleตัวอย่างงาน
Sample work on simulated data. No real patient, no client project.ตัวอย่างงานจากข้อมูลจำลองทั้งหมด ไม่ใช่ข้อมูลผู้ป่วยจริง และไม่ใช่งานของลูกค้ารายใด
What this sample containsสิ่งที่อยู่ในตัวอย่างนี้
- The statistical sections of a plan: objectives and hypotheses, the estimand with its five attributes, endpoints, analysis populations, sample size, the parts of randomisation and blinding that the analysis depends on, the primary model written out, missing data, sensitivity and subgroup analyses, multiplicity, interim analysis and software.หัวข้อด้านสถิติของแผน ได้แก่ วัตถุประสงค์และสมมติฐาน estimand ครบทั้งห้าองค์ประกอบ ตัวชี้วัดผลลัพธ์ กลุ่มประชากรที่ใช้วิเคราะห์ ขนาดตัวอย่าง รายละเอียดการสุ่มและการปกปิดเท่าที่การวิเคราะห์ต้องใช้ แบบจำลองการวิเคราะห์หลักที่เขียนออกมาครบ การจัดการข้อมูลที่ขาดหาย การวิเคราะห์ความไวและการวิเคราะห์กลุ่มย่อย การทดสอบหลายครั้ง การวิเคราะห์ระหว่างการศึกษา และซอฟต์แวร์ที่ใช้
- A sample-size calculation that states every assumption and who sets it, a check of the result by simulated trials, and the total needed when one assumption turns out less favourable.การคำนวณขนาดตัวอย่างที่ระบุข้อสมมติทุกข้อและผู้กำหนดแต่ละข้อ การตรวจสอบผลด้วยการทดลองจำลอง และจำนวนที่ต้องใช้เมื่อข้อสมมติข้อใดข้อหนึ่งไม่เป็นไปตามที่คาด
- A visit-schedule figure, an empty Table 1 shell and a primary-result shell, with a note on how to read each one.รูปตารางนัดตรวจ โครงของตาราง 1 ที่ยังไม่มีค่า และโครงตารางผลลัพธ์หลัก พร้อมคำอธิบายวิธีอ่านแต่ละชิ้น
This is the statistical part of a plan only. The clinical question, the choice of endpoint, the smallest difference that matters, the eligibility criteria and the protocol belong to the research team. The statistician turns those decisions into an estimand, a sample size and an analysis that is fixed before any result is seen.ตัวอย่างนี้เป็นเฉพาะส่วนสถิติของแผนการวิจัย คำถามทางคลินิก การเลือกตัวชี้วัดผลลัพธ์ ขนาดความแตกต่างที่น้อยที่สุดที่มีความหมายทางคลินิก เกณฑ์คัดเข้าและคัดออก และโครงร่างวิจัย เป็นการตัดสินใจของทีมวิจัย นักสถิติมีหน้าที่แปลงการตัดสินใจเหล่านั้นเป็น estimand ขนาดตัวอย่าง และแผนการวิเคราะห์ที่กำหนดไว้ล่วงหน้าก่อนเห็นผลใด ๆ
Objectives and hypothesesวัตถุประสงค์และสมมติฐาน
Primary objective: to estimate how much an invitation to the group programme changes the chair-stand count at week 12, compared with the home-exercise leaflet. Null hypothesis: the mean count at week 12 is the same in both arms. Alternative hypothesis: the means differ, tested two-sided. Secondary objectives: to estimate whether any difference persists to week 24, and the effect on usual gait speed and on the number of falls.วัตถุประสงค์หลัก: เพื่อประมาณว่าการเชิญเข้าร่วมโปรแกรมออกกำลังกายแบบกลุ่มทำให้จำนวนครั้งที่ลุกยืนจากเก้าอี้ที่สัปดาห์ที่ 12 เปลี่ยนไปเท่าใด เมื่อเทียบกับการได้รับแผ่นพับออกกำลังกายที่บ้าน สมมติฐานว่าง (null hypothesis): ค่าเฉลี่ยของจำนวนครั้งที่สัปดาห์ที่ 12 ในสองกลุ่มเท่ากัน สมมติฐานทางเลือก (alternative hypothesis): ค่าเฉลี่ยของสองกลุ่มแตกต่างกัน ทดสอบแบบสองทาง วัตถุประสงค์รอง: เพื่อประมาณว่าความแตกต่างที่พบ (ถ้ามี) ยังคงอยู่ถึงสัปดาห์ที่ 24 หรือไม่ และประมาณผลต่อความเร็วในการเดินตามปกติและจำนวนครั้งที่หกล้ม
The primary estimandEstimand หลัก
The estimand states exactly what the trial will estimate, and it is fixed before any data exist. Its five attributes:Estimand ระบุให้ชัดเจนว่าการทดลองนี้จะประมาณค่าอะไร และกำหนดไว้ก่อนมีข้อมูล ประกอบด้วยห้าองค์ประกอบดังนี้
- Population: older adults living at home who meet the protocol's eligibility criteria, as set by the research team.ประชากร (population): ผู้สูงอายุที่อาศัยอยู่ที่บ้านและผ่านเกณฑ์คัดเข้าตามโครงร่างวิจัยที่ทีมวิจัยกำหนด
- Treatment conditions: an invitation to the supervised group programme, 2 sessions a week for 12 weeks, plus usual care, against the printed home-exercise leaflet plus usual care.เงื่อนไขการรักษา (treatment conditions): การได้รับเชิญเข้าร่วมโปรแกรมออกกำลังกายแบบกลุ่มภายใต้การดูแลของผู้ฝึก สัปดาห์ละ 2 ครั้ง นาน 12 สัปดาห์ ร่วมกับการดูแลตามปกติ เทียบกับการได้รับแผ่นพับท่าออกกำลังกายที่บ้านร่วมกับการดูแลตามปกติ
- Endpoint: the 30-second chair-stand count at week 12, measured by an assessor who does not know the allocation, with a count of zero for a person who has died (composite strategy below).ตัวชี้วัดผลลัพธ์ (endpoint): จำนวนครั้งที่ลุกยืนจากเก้าอี้ได้ใน 30 วินาที ที่สัปดาห์ที่ 12 วัดโดยผู้ประเมินที่ไม่ทราบกลุ่มของผู้เข้าร่วม โดยผู้ที่เสียชีวิตให้ค่าเป็นศูนย์ครั้ง (กลยุทธ์ composite ด้านล่าง)
- Intercurrent events and the strategy for each: listed below.เหตุการณ์ที่เกิดขึ้นระหว่างการรักษา (intercurrent events) และกลยุทธ์ที่ใช้กับแต่ละเหตุการณ์: ดูรายการถัดไป
- Population-level summary: the difference in mean chair-stand count at week 12 between the arms, programme minus leaflet. It is estimated by the ANCOVA below, adjusted for the baseline count and walking-aid use, with its 95% confidence interval.ค่าสรุประดับประชากร (population-level summary): ผลต่างของค่าเฉลี่ยจำนวนครั้งที่ลุกยืนจากเก้าอี้ที่สัปดาห์ที่ 12 ระหว่างสองกลุ่ม (กลุ่มโปรแกรมลบกลุ่มแผ่นพับ) ซึ่งประมาณด้วย ANCOVA ด้านล่างที่ปรับด้วยค่าที่ baseline และการใช้อุปกรณ์ช่วยเดิน พร้อมช่วงความเชื่อมั่น 95%
The intercurrent events the plan expects, and how each one is handled:เหตุการณ์ที่เกิดขึ้นระหว่างการรักษาที่คาดว่าจะพบ และวิธีจัดการกับแต่ละเหตุการณ์
- Attending few of the 24 sessions, or stopping them: treatment-policy strategy. The count is used whatever the attendance, because the question is about offering the programme, not about full attendance.เข้าร่วมการฝึกเพียงไม่กี่ครั้งจากทั้งหมด 24 ครั้ง หรือเลิกเข้าร่วม: ใช้กลยุทธ์ treatment policy คือใช้ค่าที่วัดได้โดยไม่คำนึงถึงจำนวนครั้งที่เข้าร่วม เพราะคำถามวิจัยคือผลของการเสนอโปรแกรม ไม่ใช่ผลของการเข้าร่วมครบทุกครั้ง
- Starting another structured exercise programme outside the trial: treatment-policy strategy, for the same reason. It is recorded and reported by arm.เริ่มเข้าร่วมโปรแกรมออกกำลังกายอื่นที่มีรูปแบบชัดเจนนอกการทดลอง: ใช้กลยุทธ์ treatment policy ด้วยเหตุผลเดียวกัน โดยบันทึกและรายงานแยกตามกลุ่ม
- Death before week 12, expected to be rare: composite strategy. The person is given a count of zero, because being alive and able to stand is part of the outcome; deaths are reported by arm, and if any death occurs, a sensitivity analysis leaves these counts out.เสียชีวิตก่อนสัปดาห์ที่ 12 ซึ่งคาดว่าพบได้น้อย: ใช้กลยุทธ์ composite โดยกำหนดให้จำนวนครั้งเป็นศูนย์ เพราะการมีชีวิตอยู่และลุกยืนได้เป็นส่วนหนึ่งของผลลัพธ์ รายงานจำนวนผู้เสียชีวิตแยกตามกลุ่ม และหากมีผู้เสียชีวิต จะวิเคราะห์ความไวโดยไม่รวมค่าที่กำหนดนี้
Endpointsตัวชี้วัดผลลัพธ์
- Primary: the chair-stand count at week 12, in stands; a higher count means better leg strength.ตัวชี้วัดผลลัพธ์หลัก: จำนวนครั้งที่ลุกยืนจากเก้าอี้ที่สัปดาห์ที่ 12 หน่วยเป็นครั้ง ค่ายิ่งสูงหมายถึงกำลังกล้ามเนื้อขายิ่งดี
- Secondary: the chair-stand count at week 24; usual gait speed at week 12, in metres per second; and the number of falls from randomisation to week 24, from a falls diary.ตัวชี้วัดผลลัพธ์รอง: จำนวนครั้งที่ลุกยืนจากเก้าอี้ที่สัปดาห์ที่ 24 ความเร็วในการเดินตามปกติที่สัปดาห์ที่ 12 หน่วยเป็นเมตรต่อวินาที และจำนวนครั้งที่หกล้มตั้งแต่การสุ่มจนถึงสัปดาห์ที่ 24 จากสมุดบันทึกการหกล้ม
- Reported descriptively, not as endpoints: attendance at the group sessions and adverse events.รายงานเชิงพรรณนาโดยไม่ถือเป็นตัวชี้วัดผลลัพธ์: การเข้าร่วมการฝึกแบบกลุ่ม และเหตุการณ์ไม่พึงประสงค์
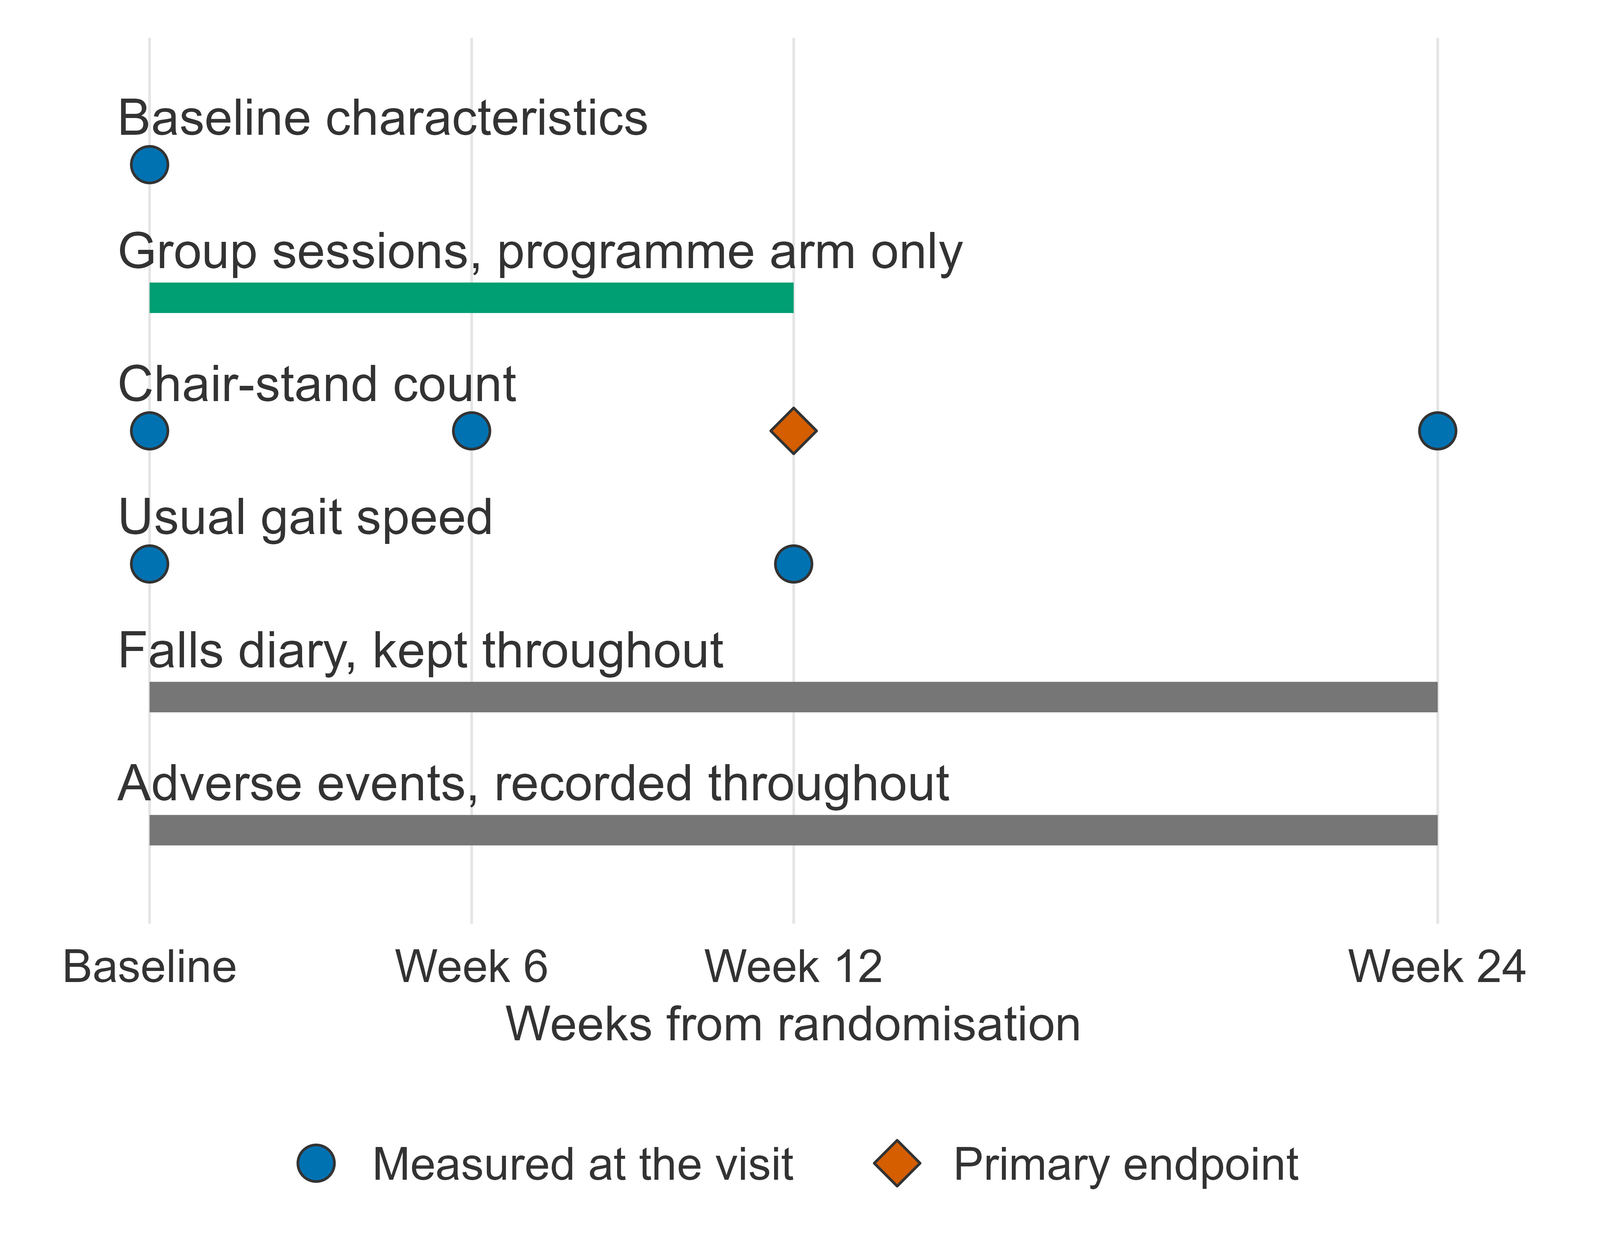
How to read it: each row is one measurement; a dot is a visit and a bar is a period of continuous recording. The week-6 chair-stand count is not an endpoint: it is collected so that the multiple imputation has a measurement close in time when a week-12 count is missing.วิธีอ่าน: แต่ละแถวคือการวัดหนึ่งรายการ จุดคือการนัดตรวจ และแถบคือช่วงเวลาที่บันทึกต่อเนื่อง จำนวนครั้งที่ลุกยืนจากเก้าอี้ที่สัปดาห์ที่ 6 ไม่ใช่ตัวชี้วัดผลลัพธ์ แต่เก็บไว้เพื่อให้การแทนค่าข้อมูลที่ขาดหายแบบพหุ (multiple imputation) มีค่าที่วัดในช่วงเวลาใกล้เคียง เมื่อค่าที่สัปดาห์ที่ 12 ขาดหายไป
Analysis populationsกลุ่มประชากรที่ใช้ในการวิเคราะห์
- Intention-to-treat population: everyone randomised, analysed in the arm they were allocated to, whatever their attendance. All effect estimates use it, which matches the treatment-policy strategy of the estimand.ประชากรตามหลัก intention-to-treat: ผู้ที่ได้รับการสุ่มทุกคน วิเคราะห์ตามกลุ่มที่ถูกสุ่มเข้า ไม่ว่าจะเข้าร่วมการฝึกมากน้อยเพียงใด การประมาณผลทั้งหมดใช้ประชากรนี้ ซึ่งสอดคล้องกับกลยุทธ์ treatment policy ของ estimand
- Safety population: everyone randomised; a person who attended at least one group session is analysed in the programme arm, everyone else in the leaflet arm; used for adverse events.ประชากรสำหรับประเมินความปลอดภัย (safety population): ผู้ที่ได้รับการสุ่มทุกคน ผู้ที่เข้าร่วมการฝึกแบบกลุ่มอย่างน้อยหนึ่งครั้งวิเคราะห์ในกลุ่มโปรแกรม ผู้อื่นวิเคราะห์ในกลุ่มแผ่นพับ ใช้สำหรับรายงานเหตุการณ์ไม่พึงประสงค์
- No per-protocol analysis of the primary estimand: attendance is already handled by the treatment-policy strategy, and keeping only good attenders would no longer compare randomised groups.ไม่มีการวิเคราะห์แบบ per-protocol สำหรับ estimand หลัก เพราะเรื่องการเข้าร่วมได้จัดการด้วยกลยุทธ์ treatment policy แล้ว และการเลือกเฉพาะผู้ที่เข้าร่วมสม่ำเสมอจะทำให้ไม่ได้เปรียบเทียบกลุ่มที่ได้จากการสุ่มอีกต่อไป
Sample sizeขนาดตัวอย่าง
The calculation uses five inputs from the research team: the smallest difference in mean count that matters, 2.0 stands; the standard deviation (SD) of the count, 4.0 stands; the correlation between the baseline and week-12 counts, 0.60; the power, 90%; and the expected loss to follow-up, 15%. The significance level is 0.05, two-sided.การคำนวณใช้ข้อมูลนำเข้าห้าค่าจากทีมวิจัย ได้แก่ ความแตกต่างของค่าเฉลี่ยที่น้อยที่สุดที่มีความหมาย 2.0 ครั้ง ส่วนเบี่ยงเบนมาตรฐาน (SD) ของจำนวนครั้ง 4.0 ครั้ง สหสัมพันธ์ระหว่างค่าที่ baseline กับค่าที่สัปดาห์ที่ 12 เท่ากับ 0.60 อำนาจการทดสอบ (power) 90% และสัดส่วนที่คาดว่าจะสูญหายจากการติดตาม 15% ใช้ระดับนัยสำคัญ 0.05 แบบสองทาง
Because the primary model adjusts for the baseline count, the residual SD is the SD multiplied by the square root of one minus the squared correlation: 3.20 stands. A two-sample t-test calculation on that residual SD needs 55 participants with a week-12 count in each arm. Allowing for loss to follow-up, 65 are randomised per arm, 130 in total. The walking-aid term of the primary model is left out of the calculation, so any precision it adds is a margin, not a requirement.เนื่องจากแบบจำลองหลักปรับด้วยค่าที่ baseline ส่วนเบี่ยงเบนมาตรฐานของส่วนเหลือ (residual SD) จึงเท่ากับ SD คูณรากที่สองของหนึ่งลบกำลังสองของสหสัมพันธ์ ได้ 3.20 ครั้ง การคำนวณแบบ two-sample t-test ด้วย residual SD นี้ต้องมีผู้เข้าร่วมที่มีค่าที่สัปดาห์ที่ 12 กลุ่มละ 55 คน เมื่อเผื่อการสูญหายจากการติดตามแล้วต้องสุ่มเข้ากลุ่มละ 65 คน รวม 130 คน การคำนวณนี้ไม่ได้นับรวมตัวแปรการใช้อุปกรณ์ช่วยเดินในแบบจำลองหลัก ความแม่นยำที่เพิ่มขึ้นจากตัวแปรนี้จึงเป็นส่วนเผื่อ ไม่ใช่สิ่งที่การคำนวณต้องพึ่งพา
Check by simulation: 5,000 trials with 55 participants per arm, all with a week-12 count, were simulated under the same assumptions, and each was analysed with the ANCOVA on the baseline count. The share of trials with P below 0.05 was 90.1%, against 90.1% from the formula at the rounded-up size, a difference within simulation error.การตรวจสอบด้วยการจำลอง: จำลองการทดลอง 5,000 ครั้ง แต่ละครั้งมีผู้เข้าร่วมที่มีค่าที่สัปดาห์ที่ 12 กลุ่มละ 55 คน ภายใต้ข้อสมมติเดียวกัน และวิเคราะห์แต่ละครั้งด้วย ANCOVA ที่ปรับด้วยค่าที่ baseline สัดส่วนของการทดลองที่ได้ค่า P น้อยกว่า 0.05 เท่ากับ 90.1% เทียบกับ 90.1% จากสูตรที่ขนาดตัวอย่างหลังปัดขึ้น ความต่างนี้อยู่ในขอบเขตความคลาดเคลื่อนของการจำลอง
| Item | Value | Set by or computed as |
|---|---|---|
| Assumptions | ||
| Smallest difference that matters, stands | 2.0 | Research team |
| SD of the chair-stand count, stands | 4.0 | Research team, earlier data |
| Correlation of baseline and end-of-programme counts | 0.60 | Research team, earlier data |
| Significance level, two-sided | 0.05 | Convention |
| Power | 90% | Research team |
| Loss to follow-up | 15% | Research team |
| Result | ||
| Residual SD after baseline adjustment, stands | 3.20 | SD × √(1 − r²) |
| Participants with an end-of-programme count, per arm | 55 | Two-sample t-test on the residual SD |
| Participants to randomise, per arm | 65 | Divided by (1 − loss), rounded up |
| Participants to randomise, total | 130 | Both arms |
| Check by simulation | ||
| Simulated trials, 55 per arm, complete data | 5,000 | Statistician's choice; fixed random seed |
| Power of the ANCOVA in the simulated trials | 90.1% | Share of trials with P below the significance level |
| Power of the formula at the rounded-up size | 90.1% | Two-sample t-test |
| If one assumption is less favourable | ||
| SD of 4.5 stands | 166 | Total to randomise |
| Correlation of 0.50 | 154 | Total to randomise |
| Loss to follow-up of 20% | 138 | Total to randomise |
| No baseline adjustment | 204 | Total to randomise, t-test on the end count |
- SD, standard deviation; r, the correlation of the baseline and end-of-programme counts. The rows under the last heading change one assumption at a time and keep the others as planned.SD คือส่วนเบี่ยงเบนมาตรฐาน r คือสหสัมพันธ์ระหว่างค่าที่ baseline กับค่าเมื่อจบโปรแกรม แถวในหัวข้อสุดท้ายเปลี่ยนข้อสมมติครั้งละหนึ่งข้อ โดยคงข้ออื่นไว้ตามแผน
How to read it: the first rows are the inputs and who sets each one; only the significance level is a convention. The last rows show the total to randomise when one input is less favourable than planned: an SD of 4.5 stands needs 166, a correlation of 0.50 needs 154, a loss to follow-up of 20% needs 138, and an analysis without baseline adjustment would need 204. Which of these risks to cover is the research team's decision.วิธีอ่าน: แถวแรก ๆ คือข้อมูลนำเข้าและผู้กำหนดแต่ละค่า มีเพียงระดับนัยสำคัญที่เป็นค่าตามธรรมเนียม แถวท้ายตารางแสดงจำนวนรวมที่ต้องสุ่มเมื่อข้อมูลนำเข้าข้อใดข้อหนึ่งไม่เป็นไปตามที่คาด ถ้า SD เท่ากับ 4.5 ครั้ง ต้องใช้ 166 คน ถ้าสหสัมพันธ์เท่ากับ 0.50 ต้องใช้ 154 คน ถ้าสูญหายจากการติดตาม 20% ต้องใช้ 138 คน และถ้าวิเคราะห์โดยไม่ปรับค่าที่ baseline จะต้องใช้ 204 คน การเลือกว่าจะเผื่อความเสี่ยงข้อใดเป็นการตัดสินใจของทีมวิจัย
Randomisation and blinding, as far as the analysis needs themการสุ่มและการปกปิด เท่าที่เกี่ยวข้องกับการวิเคราะห์
Participants are allocated in equal numbers to the two arms from a computer-generated list in permuted blocks of varying size, stratified by walking-aid use; because of this stratification, walking-aid use is a covariate in the primary model. The list is prepared by a statistician who does not recruit, and each allocation stays concealed until the participant is enrolled. Participants and instructors cannot be blinded; the assessors who run the chair-stand and gait-speed tests do not know the allocation. The analysis code is written and checked with the arm labels masked, and the labels are revealed only after the database is locked and this plan is signed off.ผู้เข้าร่วมถูกจัดเข้าสองกลุ่มในจำนวนเท่ากันตามรายการสุ่มที่สร้างด้วยคอมพิวเตอร์ แบบ permuted block ที่ขนาดบล็อกไม่คงที่ และแบ่งชั้น (stratified) ตามการใช้อุปกรณ์ช่วยเดิน ด้วยเหตุนี้การใช้อุปกรณ์ช่วยเดินจึงเป็นตัวแปรร่วม (covariate) ในแบบจำลองหลัก รายการสุ่มจัดทำโดยนักสถิติที่ไม่มีส่วนในการรับผู้เข้าร่วม และปกปิดลำดับการสุ่ม (allocation concealment) จนกว่าผู้เข้าร่วมแต่ละรายจะเข้าสู่การศึกษา ไม่สามารถปกปิดข้อมูลกลุ่มจากผู้เข้าร่วมและผู้ฝึกได้ แต่ผู้ประเมินที่ทดสอบการลุกยืนจากเก้าอี้และความเร็วในการเดินไม่ทราบกลุ่ม โค้ดการวิเคราะห์เขียนและตรวจสอบโดยปิดชื่อกลุ่มไว้ และจะเปิดชื่อกลุ่มหลังจากปิดฐานข้อมูลและแผนนี้ได้รับการรับรองเป็นฉบับสุดท้ายแล้วเท่านั้น
Primary analysis modelแบบจำลองการวิเคราะห์หลัก
Analysis of covariance (ANCOVA) in the intention-to-treat population: Y = α + β·A + γ·B + θ·W + ε, where Y is the chair-stand count at week 12, A indicates the programme arm, B is the baseline count, W indicates walking-aid use (the stratification factor) and ε is a normally distributed error with constant variance. The least-squares estimate of β is the estimator of the population-level summary of the estimand, the difference in mean count, programme minus leaflet; it is reported with its 95% confidence interval and two-sided P value.การวิเคราะห์ความแปรปรวนร่วม (ANCOVA) ในประชากร intention-to-treat: Y = α + β·A + γ·B + θ·W + ε โดย Y คือจำนวนครั้งที่ลุกยืนจากเก้าอี้ที่สัปดาห์ที่ 12 A คือตัวแปรบ่งชี้กลุ่มโปรแกรม B คือค่าที่ baseline W คือตัวแปรบ่งชี้การใช้อุปกรณ์ช่วยเดิน (ตัวแปรที่ใช้แบ่งชั้นในการสุ่ม) และ ε คือความคลาดเคลื่อนที่แจกแจงแบบปกติและมีความแปรปรวนคงที่ ค่าประมาณของ β จากวิธีกำลังสองน้อยที่สุด (least squares) คือตัวประมาณ (estimator) ของค่าสรุประดับประชากรของ estimand ได้แก่ ผลต่างของค่าเฉลี่ยจำนวนครั้ง (กลุ่มโปรแกรมลบกลุ่มแผ่นพับ) รายงานพร้อมช่วงความเชื่อมั่น 95% และค่า P แบบสองทาง
Why ANCOVA and not the change from baseline: in a randomised trial, adjusting for the baseline count gives an unbiased estimate with a smaller standard error than comparing change scores, which is also why the sample size uses the residual SD. Model checks: a plot of residuals against fitted values and a normal Q-Q plot of the residuals; with a sample of this size the estimate of β is robust to moderate departures from normality.เหตุผลที่ใช้ ANCOVA แทนการเปรียบเทียบค่าที่เปลี่ยนแปลงจาก baseline: ในการทดลองแบบสุ่ม การปรับด้วยค่าที่ baseline ให้ค่าประมาณที่ไม่ลำเอียงและมีความคลาดเคลื่อนมาตรฐานน้อยกว่าการเปรียบเทียบค่าที่เปลี่ยนแปลง ซึ่งเป็นเหตุผลเดียวกับที่การคำนวณขนาดตัวอย่างใช้ residual SD การตรวจสอบแบบจำลอง: ดูกราฟ residual เทียบกับค่าที่ทำนายได้ (fitted values) และ normal Q-Q plot ของ residual เมื่อขนาดตัวอย่างเท่านี้ ค่าประมาณของ β ทนต่อการเบี่ยงเบนจากการแจกแจงแบบปกติในระดับปานกลางได้
Secondary endpoints: the week-24 chair-stand count and gait speed use the same ANCOVA and imputation approach, each adjusted for its own baseline value. Falls use negative binomial regression with the log of each person's follow-up time as offset, adjusted for walking-aid use, and are reported as a rate ratio.ตัวชี้วัดผลลัพธ์รอง: จำนวนครั้งที่ลุกยืนจากเก้าอี้ที่สัปดาห์ที่ 24 และความเร็วในการเดิน วิเคราะห์ด้วย ANCOVA และวิธีแทนค่าข้อมูลแบบเดียวกัน โดยปรับด้วยค่าที่ baseline ของตัวแปรนั้นเอง ส่วนจำนวนครั้งที่หกล้มวิเคราะห์ด้วย negative binomial regression โดยใช้ log ของระยะเวลาติดตามของแต่ละคนเป็น offset ปรับด้วยการใช้อุปกรณ์ช่วยเดิน และรายงานเป็นอัตราส่วนอัตรา (rate ratio)
Missing dataข้อมูลที่ขาดหาย
- Assumption: a missing week-12 count is missing at random given the arm, the baseline count, walking-aid use and the week-6 count.ข้อสมมติ: ค่าที่สัปดาห์ที่ 12 ขาดหายแบบสุ่ม (missing at random, MAR) เมื่อพิจารณากลุ่ม ค่าที่ baseline การใช้อุปกรณ์ช่วยเดิน และค่าที่สัปดาห์ที่ 6 แล้ว
- Primary method: multiple imputation by chained equations, 50 imputed datasets, done separately in each arm. Each dataset is analysed with the primary ANCOVA and the results are combined with Rubin's rules, with Barnard–Rubin degrees of freedom for the 95% confidence interval and P value. Counts set by the composite strategy for death are not imputed.วิธีหลัก: การแทนค่าข้อมูลที่ขาดหายแบบพหุด้วยสมการลูกโซ่ (multiple imputation by chained equations) จำนวน 50 ชุด โดยแทนค่าแยกกันในแต่ละกลุ่ม วิเคราะห์แต่ละชุดด้วย ANCOVA หลัก แล้วรวมผลด้วย Rubin's rules โดยใช้องศาอิสระแบบ Barnard–Rubin สำหรับช่วงความเชื่อมั่น 95% และค่า P ค่าที่กำหนดตามกลยุทธ์ composite สำหรับผู้เสียชีวิตจะไม่ถูกแทนค่า
- Sensitivity: a delta-adjusted tipping-point analysis lowers the imputed counts in the arm that the primary result favours by δ stands, from 0.5 to 3.0 in steps of 0.5 (6 shifts), and reports the smallest δ at which the 95% confidence interval comes to include no difference. It is run only when the primary 95% confidence interval excludes no difference; if no shift up to 3.0 stands changes that, the result is reported as greater than 3.0 stands. A complete-case ANCOVA is reported as well.การวิเคราะห์ความไว: การวิเคราะห์จุดพลิก (tipping-point analysis) แบบ delta-adjusted โดยลดค่าที่แทนในกลุ่มที่ผลหลักชี้ว่าดีกว่าลง δ ครั้ง ตั้งแต่ 0.5 ถึง 3.0 เพิ่มทีละ 0.5 (รวม 6 ค่า) แล้วรายงานค่า δ ที่น้อยที่สุดที่ทำให้ช่วงความเชื่อมั่น 95% ครอบคลุมค่าศูนย์ (ไม่มีความแตกต่าง) การวิเคราะห์นี้ทำเฉพาะเมื่อช่วงความเชื่อมั่น 95% ของผลหลักไม่ครอบคลุมค่าศูนย์ ถ้าเลื่อนค่าจนถึง 3.0 ครั้งแล้วช่วงความเชื่อมั่นยังไม่ครอบคลุมค่าศูนย์ จะรายงานว่ามากกว่า 3.0 ครั้ง และรายงาน ANCOVA เฉพาะผู้ที่มีข้อมูลครบ (complete case) ด้วย
Sensitivity and subgroup analysesการวิเคราะห์ความไวและการวิเคราะห์กลุ่มย่อย
Every analysis below is pre-specified here and they are kept few, so that none can be chosen after the results are seen.การวิเคราะห์ทั้งหมดต่อไปนี้กำหนดไว้ล่วงหน้าในแผนนี้และจำกัดจำนวนไว้ เพื่อไม่ให้มีการเลือกการวิเคราะห์หลังจากเห็นผลแล้ว
- Sensitivity: the complete-case ANCOVA, which assumes that missingness depends only on the model's covariates; the tipping-point analysis above, which asks how far the missing-at-random assumption can fail before the conclusion changes; and, only if a death occurs, the primary analysis without the counts set for deaths, which checks that a few counts of zero do not drive the result.การวิเคราะห์ความไว: ANCOVA เฉพาะผู้ที่มีข้อมูลครบ ซึ่งสมมติว่าการขาดหายขึ้นกับตัวแปรร่วมในแบบจำลองเท่านั้น การวิเคราะห์จุดพลิกข้างต้น ซึ่งถามว่าข้อสมมติ MAR ผิดไปได้มากเพียงใดก่อนที่ข้อสรุปจะเปลี่ยน และเฉพาะเมื่อมีผู้เสียชีวิต การวิเคราะห์หลักโดยไม่รวมค่าที่กำหนดให้ผู้เสียชีวิต เพื่อตรวจว่าค่าศูนย์เพียงไม่กี่ค่าไม่ได้เป็นตัวกำหนดผล
- Subgroups: walking-aid use and sex only. Each adds an arm-by-subgroup interaction to the primary model and reports the effect in each subgroup with the interaction P value. The trial has no power for these comparisons, so they are exploratory.กลุ่มย่อย: การใช้อุปกรณ์ช่วยเดินและเพศเท่านั้น แต่ละการวิเคราะห์เพิ่มพจน์อันตรกิริยา (interaction) ระหว่างกลุ่มการรักษากับกลุ่มย่อยเข้าไปในแบบจำลองหลัก และรายงานผลในแต่ละกลุ่มย่อยพร้อมค่า P ของอันตรกิริยา การทดลองนี้ไม่มีอำนาจการทดสอบเพียงพอสำหรับการเปรียบเทียบเหล่านี้ จึงถือเป็นการวิเคราะห์เชิงสำรวจ (exploratory)
Multiplicityการทดสอบหลายครั้ง (multiplicity)
There is one primary endpoint and one comparison, so the primary test needs no adjustment and uses the two-sided level 0.05. Secondary endpoints are reported as estimates with 95% confidence intervals and no P values, and subgroup results with interaction P values only; both are read as supporting information, not as further confirmatory claims.มีตัวชี้วัดผลลัพธ์หลักเพียงตัวเดียวและการเปรียบเทียบเพียงคู่เดียว การทดสอบหลักจึงไม่ต้องปรับสำหรับการทดสอบหลายครั้ง และใช้ระดับนัยสำคัญ 0.05 แบบสองทาง ตัวชี้วัดผลลัพธ์รองรายงานเป็นค่าประมาณพร้อมช่วงความเชื่อมั่น 95% โดยไม่แสดงค่า P ส่วนผลในกลุ่มย่อยแสดงเฉพาะค่า P ของอันตรกิริยา ผลทั้งสองส่วนนี้ใช้เป็นข้อมูลสนับสนุน ไม่ใช่ข้อสรุปเชิงยืนยัน (confirmatory) เพิ่มเติม
Interim analysisการวิเคราะห์ระหว่างการศึกษา (interim analysis)
None. No interim analysis of effect is planned, there is no stopping rule for benefit or futility, and nobody sees results by arm before the database is locked. Safety events are reviewed as the protocol sets out.ไม่มี แผนนี้ไม่มีการวิเคราะห์ผลระหว่างการศึกษา ไม่มีเกณฑ์ยุติการศึกษาก่อนกำหนดเพราะได้ผลชัดเจนหรือเพราะไม่น่าจะได้ผล (futility) และไม่มีผู้ใดเห็นผลแยกตามกลุ่มก่อนปิดฐานข้อมูล การติดตามเหตุการณ์ด้านความปลอดภัยเป็นไปตามที่โครงร่างวิจัยกำหนด
Softwareซอฟต์แวร์
All analyses are run in R. The sample size on this page was computed with R version 4.6.1; the versions of R and of every package used for the final analysis, and its random seed, are recorded with its outputs so that the analysis can be rerun exactly.การวิเคราะห์ทั้งหมดทำด้วยโปรแกรม R ขนาดตัวอย่างในหน้านี้คำนวณด้วย R เวอร์ชัน 4.6.1 ส่วนเวอร์ชันของ R และของแพ็กเกจทุกตัวที่ใช้ในการวิเคราะห์จริง รวมทั้งค่า seed จะบันทึกไว้พร้อมผลการวิเคราะห์ เพื่อให้รันการวิเคราะห์ซ้ำได้ผลเหมือนเดิม
Table shellsโครงตาราง (table shells)
Table shells fix the layout of the results before any data exist. Each x stands for a digit the analysis will fill, so the number of decimals is decided in advance as well.โครงตารางกำหนดรูปแบบการนำเสนอผลไว้ก่อนมีข้อมูล ตัว x แต่ละตัวแทนตัวเลขหนึ่งหลักที่จะเติมเมื่อวิเคราะห์จริง จำนวนตำแหน่งทศนิยมจึงถูกกำหนดไว้ล่วงหน้าด้วย
| Characteristic | Exercise programme (n = xx) | Home leaflet (n = xx) |
|---|---|---|
| Participants | ||
| Age, years, mean (SD) | xx.x (xx.x) | xx.x (xx.x) |
| Women, n (%) | xx (xx.x%) | xx (xx.x%) |
| Lives alone, n (%) | xx (xx.x%) | xx (xx.x%) |
| Function and falls at baseline | ||
| Chair-stand count, stands, mean (SD) | xx.x (xx.x) | xx.x (xx.x) |
| Usual gait speed, m/s, mean (SD) | x.xx (x.xx) | x.xx (x.xx) |
| Uses a walking aid, n (%)* | xx (xx.x%) | xx (xx.x%) |
| At least one fall in the past year, n (%) | xx (xx.x%) | xx (xx.x%) |
- * Stratification factor of the randomisation.* ตัวแปรที่ใช้แบ่งชั้นในการสุ่ม
- SD, standard deviation. n = xx is the number randomised to each arm; xx.x marks a cell the analysis fills.SD คือส่วนเบี่ยงเบนมาตรฐาน n = xx คือจำนวนผู้ที่ถูกสุ่มเข้าแต่ละกลุ่ม และ xx.x แทนช่องที่จะเติมค่าเมื่อวิเคราะห์จริง
How to read it: the table describes the two arms side by side and has no P value column. In a randomised trial any baseline difference arises by chance, so testing it answers no useful question. The adjustment covers only the covariates fixed in this plan; no covariate is added after looking at the data.วิธีอ่าน: ตารางนี้บรรยายลักษณะของสองกลุ่มเคียงกันและไม่มีคอลัมน์ค่า P เพราะในการทดลองแบบสุ่ม ความแตกต่างที่ baseline เกิดจากความบังเอิญอยู่แล้ว การทดสอบจึงไม่ได้ตอบคำถามที่มีประโยชน์ การปรับทำเฉพาะตัวแปรร่วมที่กำหนดไว้ในแผนนี้ และจะไม่เพิ่มตัวแปรร่วมหลังจากดูข้อมูลแล้ว
| Analysis | Arm summary | Effect (95% CI) | P value | |
|---|---|---|---|---|
| Exercise programme | Home leaflet | |||
| Primary analysis, chair-stand count at the end of the programme | ||||
| ANCOVA after multiple imputation, 50 imputations | xx.x (xx.x), n = xx | xx.x (xx.x), n = xx | xx.x (xx.x to xx.x) | x.xxx |
| Sensitivity analyses of the primary endpoint | ||||
| Complete cases, ANCOVA | xx.x (xx.x), n = xx | xx.x (xx.x), n = xx | xx.x (xx.x to xx.x) | – |
| Tipping point: smallest δ whose CI includes no difference, stands | – | – | x.x or >x.x | – |
| Without the counts set for deaths, only if a death occurs | xx.x (xx.x), n = xx | xx.x (xx.x), n = xx | xx.x (xx.x to xx.x) | – |
| Secondary endpoints | ||||
| Chair-stand count at the follow-up visit, stands | xx.x (xx.x), n = xx | xx.x (xx.x), n = xx | xx.x (xx.x to xx.x) | – |
| Usual gait speed at the end of the programme, m/s | x.xx (x.xx), n = xx | x.xx (x.xx), n = xx | x.xx (x.xx to x.xx) | – |
| Falls to the follow-up visit, per person-year* | x.xx, n = xx | x.xx, n = xx | x.xx (x.xx to x.xx) | – |
| Subgroups of the primary endpoint, exploratory | ||||
| Uses a walking aid | xx.x (xx.x), n = xx | xx.x (xx.x), n = xx | xx.x (xx.x to xx.x) | x.xxx† |
| No walking aid | xx.x (xx.x), n = xx | xx.x (xx.x), n = xx | xx.x (xx.x to xx.x) | – |
| Women | xx.x (xx.x), n = xx | xx.x (xx.x), n = xx | xx.x (xx.x to xx.x) | x.xxx† |
| Men | xx.x (xx.x), n = xx | xx.x (xx.x), n = xx | xx.x (xx.x to xx.x) | – |
- Arm summary: observed mean (SD) among participants with the measurement, except the falls row (rate per person-year). n is the number analysed in each arm: everyone randomised, or everyone in the subgroup, except in the complete-case row (those with a week-12 count) and the row without deaths (those alive at week 12).ค่าสรุปรายกลุ่ม: ค่าเฉลี่ย (SD) ที่สังเกตได้ในผู้ที่มีค่าที่วัด ยกเว้นแถวการหกล้มซึ่งแสดงอัตราต่อคน-ปี ส่วน n คือจำนวนผู้ที่นำมาวิเคราะห์ในแต่ละกลุ่ม ได้แก่ ผู้ที่ได้รับการสุ่มทุกคน หรือทุกคนในกลุ่มย่อยนั้น ยกเว้นแถว complete case (ผู้ที่มีค่าที่สัปดาห์ที่ 12) และแถวที่ไม่รวมผู้เสียชีวิต (ผู้ที่ยังมีชีวิตที่สัปดาห์ที่ 12)
- Effect: the adjusted difference in means, programme minus leaflet, from the ANCOVA, with its 95% confidence interval. For the tipping-point row, the smallest δ in stands; it is shown as greater than 3.0 when no shift tried changes the result, and the row stays empty when the primary interval already includes no difference.ขนาดผล (Effect): ผลต่างของค่าเฉลี่ยที่ปรับแล้ว (กลุ่มโปรแกรมลบกลุ่มแผ่นพับ) จาก ANCOVA พร้อมช่วงความเชื่อมั่น 95% ส่วนแถวจุดพลิกแสดงค่า δ ที่น้อยที่สุด หน่วยเป็นครั้ง ถ้าไม่มีค่าที่ลองแล้วทำให้ผลเปลี่ยน จะแสดงว่ามากกว่า 3.0 และถ้าช่วงความเชื่อมั่นของผลหลักครอบคลุมค่าศูนย์อยู่แล้ว แถวนี้จะเว้นว่าง
- * Falls: the rate per person-year in each arm, and in the effect column the rate ratio from negative binomial regression.* การหกล้ม: แสดงอัตราต่อคน-ปีของแต่ละกลุ่ม และคอลัมน์ขนาดผลแสดงอัตราส่วนอัตรา (rate ratio) จาก negative binomial regression
- † P value for the interaction of arm with the subgroup, shown on the first row of each pair.† ค่า P ของอันตรกิริยาระหว่างกลุ่มการรักษากับกลุ่มย่อย แสดงในแถวแรกของแต่ละคู่
- A dash marks a cell left empty by design; x marks a digit the analysis fills.เครื่องหมายขีดแทนช่องที่ตั้งใจเว้นว่าง และ x แทนตัวเลขที่จะเติมเมื่อวิเคราะห์จริง
How to read it: the bold first row answers the primary question. The sensitivity rows show whether that answer depends on the missing-data assumption or on the counts set for deaths: a tipping-point δ that is small next to the 2.0-stand difference that matters means the result leans heavily on the missing-at-random assumption. Secondary and subgroup rows give estimates with intervals that support the primary result but do not replace it.วิธีอ่าน: แถวแรกที่เป็นตัวหนาตอบคำถามหลัก แถวของการวิเคราะห์ความไวแสดงว่าคำตอบนั้นขึ้นกับข้อสมมติเรื่องข้อมูลที่ขาดหาย หรือขึ้นกับค่าที่กำหนดให้ผู้เสียชีวิตหรือไม่ ถ้าค่า δ ที่จุดพลิกมีขนาดเล็กเมื่อเทียบกับความแตกต่างที่มีความหมาย 2.0 ครั้ง แสดงว่าผลขึ้นกับข้อสมมติ MAR มาก แถวของผลลัพธ์รองและกลุ่มย่อยให้ค่าประมาณพร้อมช่วงความเชื่อมั่น ซึ่งใช้สนับสนุนผลหลักแต่ไม่ได้แทนที่ผลหลัก
What this sample does not show: it is a plan, so there are no results, and the table shells hold placeholders, not numbers. The endpoint, the smallest difference that matters, the eligibility criteria and the protocol are the research team's decisions, and so is the interpretation of the final results. A real plan is dated and signed off before the arm labels are revealed; this page shows the content of such a plan, not that process.สิ่งที่ตัวอย่างนี้ไม่ได้แสดง: นี่เป็นแผน จึงไม่มีผลการวิเคราะห์ และโครงตารางมีเพียงตัวยึดตำแหน่ง ไม่มีตัวเลขจริง ตัวชี้วัดผลลัพธ์ ขนาดความแตกต่างที่น้อยที่สุดที่มีความหมาย เกณฑ์คัดเข้าและคัดออก และโครงร่างวิจัยเป็นการตัดสินใจของทีมวิจัย รวมถึงการแปลผลเมื่อได้ผลการวิเคราะห์จริง แผนจริงต้องลงวันที่และได้รับการรับรองก่อนเปิดชื่อกลุ่ม หน้านี้แสดงเนื้อหาของแผนดังกล่าว ไม่ได้แสดงกระบวนการนั้น
What you send and do yourselfสิ่งที่คุณต้องส่งและทำเอง
- Your draft protocol: the question, the design and the outcomes.ร่างโครงร่างวิจัยของคุณ ได้แก่ คำถามวิจัย รูปแบบการศึกษา และผลลัพธ์
- You write the background, the objectives and every other section of the protocol.คุณเป็นผู้เขียนที่มาและความสำคัญ วัตถุประสงค์ และส่วนอื่นทั้งหมดของโครงร่างวิจัยเอง
- Design decisions are yours; the plan sets out the options and what each one means for the analysis.การตัดสินใจด้านการออกแบบเป็นของคุณ แผนจะแสดงทางเลือกและผลของแต่ละทางเลือกต่อการวิเคราะห์
- You acknowledge the statistical help in the way your journal or committee asks.คุณระบุความช่วยเหลือด้านสถิติตามรูปแบบที่วารสารหรือคณะกรรมการกำหนด
Limitsขอบเขตและข้อจำกัด
- Statistical analysis and advice only: the research question, the data, the interpretation and the writing stay yours.บริการนี้เป็นงานวิเคราะห์และให้คำแนะนำทางสถิติเท่านั้น คำถามวิจัย ข้อมูล การแปลผล และการเขียน เป็นของคุณทั้งหมด
- The statistical part of the protocol only, never the whole protocol.เฉพาะส่วนสถิติของโครงร่างวิจัย ไม่ใช่โครงร่างวิจัยทั้งฉบับ
- Not for a thesis, an independent study or other work submitted for a degree; for those, I offer consultation only.ไม่รับทำงานที่จะนำไปใช้เพื่อสำเร็จการศึกษา เช่น วิทยานิพนธ์ การค้นคว้าอิสระ หรือผลงานอื่นที่ยื่นเพื่อรับปริญญา งานลักษณะนี้รับเฉพาะการให้คำปรึกษา
- Authorship is not sold and is not a condition of the service.การมีชื่อเป็นผู้นิพนธ์ไม่ใช่สิ่งที่ซื้อขายได้ และไม่ใช่เงื่อนไขในการรับงาน
Request this serviceขอใช้บริการนี้
Every request is reviewed first. I may accept or decline it. The timeline is agreed per project after review.ผมพิจารณาคำขอทุกงานก่อน และอาจรับหรือปฏิเสธงาน ระยะเวลาของแต่ละงานตกลงกันหลังพิจารณาคำขอแล้ว
Member prices apply only to orders that start on uniqcret.com; if you found me on Fastwork or your enquiry began there, please order on Fastwork at the Fastwork price.ราคาสมาชิกใช้กับงานที่เริ่มต้นบน uniqcret.com เท่านั้น หากคุณรู้จักผมจาก Fastwork หรือเริ่มสอบถามบน Fastwork กรุณาสั่งงานบน Fastwork ในราคาของ Fastwork