Prediction Stability in TRIPOD-Ready Clinical Prediction Models: The Multiverse Perspective

On this page
Background
Internal validation is not only about how good your model looks in the development dataset, but also about how dependable the model is when the dataset changes slightly. In practice, we need two complementary bootstrap stories:
- Optimism bootstrap (overfitting / performance bias)“Is the apparent performance too good because the model is overfit?”
- Stability bootstrap (instability / model sensitivity)“If the data change a little, does the model change a lot?”This is the “multiverse” concept: many plausible models could have been developed from the same target population, and a patient’s predicted risk can vary across those models.
In Thai clinical-stat language: stability = เสถียร (stable). The opposite is instability (ไม่เสถียร).
Conceptual Link: Why You Need Both Bootstraps
A) Optimism Bootstrap (Performance-focused Internal Validation)
- Goal: estimate how much apparent performance is inflated by overfitting.
- Output: optimism-corrected performance (e.g., corrected c-statistic, corrected calibration slope).
- Interpretation: “My performance estimate is not too optimistic.”
B) Stability Bootstrap (Reliability-focused Internal Validation)
- Goal: quantify how much the model itself and individual predictions vary when the dataset changes slightly.
- Output: instability in (i) model structure, (ii) coefficients, and (iii) patient-level predictions.
- Interpretation: “My model is reliable for individual patients.”
Key bridge: A model can have “good” optimism-corrected performance and still be clinically unsafe if individual predictions are unstable.
METHODS
Study Context and Model Development
Describe your development exactly once, because stability bootstrap will repeat it:
- Outcome definition and time horizon
- Candidate predictors
- Missing data handling
- Predictor handling strategy
- If you used MFP (multivariable fractional polynomials), say so
- If you used linear terms, say so
- If you used lasso / penalization, specify tuning procedure
Critical rule (your point is correct):
In each bootstrap sample, you must redevelop the model using the identical method used in the original development (same candidate predictors, same MFP process, same selection rules, same penalty/tuning strategy).
Internal Validation Part 1: Optimism Bootstrap (Overfitting of Apparent Performance)
Aim
To quantify how much apparent performance is exaggerated due to overfitting.
Procedure (typical wording)
- Fit the model in the original dataset and record apparent performance.
- Draw bootstrap samples, refit the model in each sample, evaluate in bootstrap and original data, estimate optimism, and subtract it from apparent performance.
- Report optimism-corrected metrics (e.g., discrimination, calibration slope).
(Keep this short; your audience usually already recognizes this bootstrap purpose.)
Internal Validation Part 2: Stability Bootstrap (Instability / Multiverse Assessment)
Aim
To evaluate whether small perturbations in data lead to large changes in:
- model structure
- model parameters
- individual predicted risks (clinically most important)
Bootstrap size
Use B ≥ 200 (your instruction is aligned with recommendations).
Algorithm (write as steps in Methods)
For each bootstrap iteration b = 1, …, B:
- Sample n individuals with replacement from the development dataset.
- Redevelop the model in the bootstrap sample using the same development pipeline as the original model.
- Apply the bootstrap-developed model back to the original development dataset to obtain predicted risks p̂_bi for each individual i.
- Store p̂_bi alongside the original model prediction p̂_i.
Resulting prediction set
This yields, for each patient i:
p̂_i, p̂_1i, p̂_2i, …, p̂_Bi
This is the multiverse of plausible predictions.
What to Measure (Pre-specify these outputs)
1) Model Structure Instability (What changes in the model?)
Report:
- Variable selection frequency (selected often vs rarely)
- Functional form instability (MFP form changes? linear vs non-linear patterns)
- Optional: model size distribution (# predictors retained)
Results formats:
- Table: “Predictor retained in X% of bootstrap models”
- Table: “MFP functional forms frequency by predictor”
2) Coefficient Instability (β drift)
Report:
- Bootstrap distributions of each \(\beta\)
- Variability / spread (e.g., SD, IQR)
- Width of confidence intervals (wide = unstable estimation)
Results formats:
- Table: median β, 2.5–97.5 percentiles
- Plot: coefficient distribution / interval plot (supplement usually)
3) Prediction Instability (Clinically most important)
This is your “same patient, different universe” question:
“Does the same patient get 10% risk in one bootstrap model and 30% in another?”
Core metric: Individual-level MAPE
For each patient:
Then summarise across patients (mean/median, max, percentiles).
Core figure: Prediction Instability Plot
- x-axis: original prediction p̂_i
- y-axis: bootstrap predictions p̂_bi
- Add 95% prediction interval bands (2.5th/97.5th percentiles) if you want.
This plot is the visual proof of stability (เสถียร) vs instability.
Optional but Recommended Extensions (Separate subsections)
A) Classification Stability (Decision instability at a threshold)
If your model is used with a treatment threshold (e.g., 10%):
- Compute the probability that classification flips across bootstrap models.
- Show Classification Instability Plot (instability index vs p̂_i).
B) Calibration Instability (Population-level stability)
Overlay calibration curves from bootstrap models applied to the original dataset:
- This is the standard calibration plot plus bootstrap “spaghetti” lines.
RESULTS (How to Lay It Out Correctly)
Results Section 1: Optimism-Corrected Performance (Internal Validation)
Report in 1–2 paragraphs + a small table:
- Apparent vs optimism-corrected discrimination
- Apparent vs optimism-corrected calibration slope / intercept
- (Optional) optimism-corrected net benefit
Table example: “Apparent vs Optimism-corrected performance”
Results Section 2: Stability (เสถียร) Assessment (Bootstrap Multiverse)
2.1 Model Structure Stability
- Table: predictor selection frequency
- Table: MFP functional form frequency (if applicable)
- Brief narrative: “Which predictors/forms are unstable?”
2.2 Parameter Stability
- Table: β median and 2.5–97.5 percentiles
- Comment: which coefficients are highly variable and clinically important?
2.3 Individual Prediction Stability (Primary clinical focus)
- Figure 1 (main): Prediction instability plot
- Table: MAPE summary (mean/median/max; perhaps by risk strata)
- Narrative example:
- “Overall MAPE was low/high.”
- “Some individuals showed wide ranges of predicted risks.”
2.4 Decision Stability (if threshold-based use)
- Figure 2 (optional main / supplement): Classification instability plot
- Text: who is vulnerable to flipping? (usually near threshold)
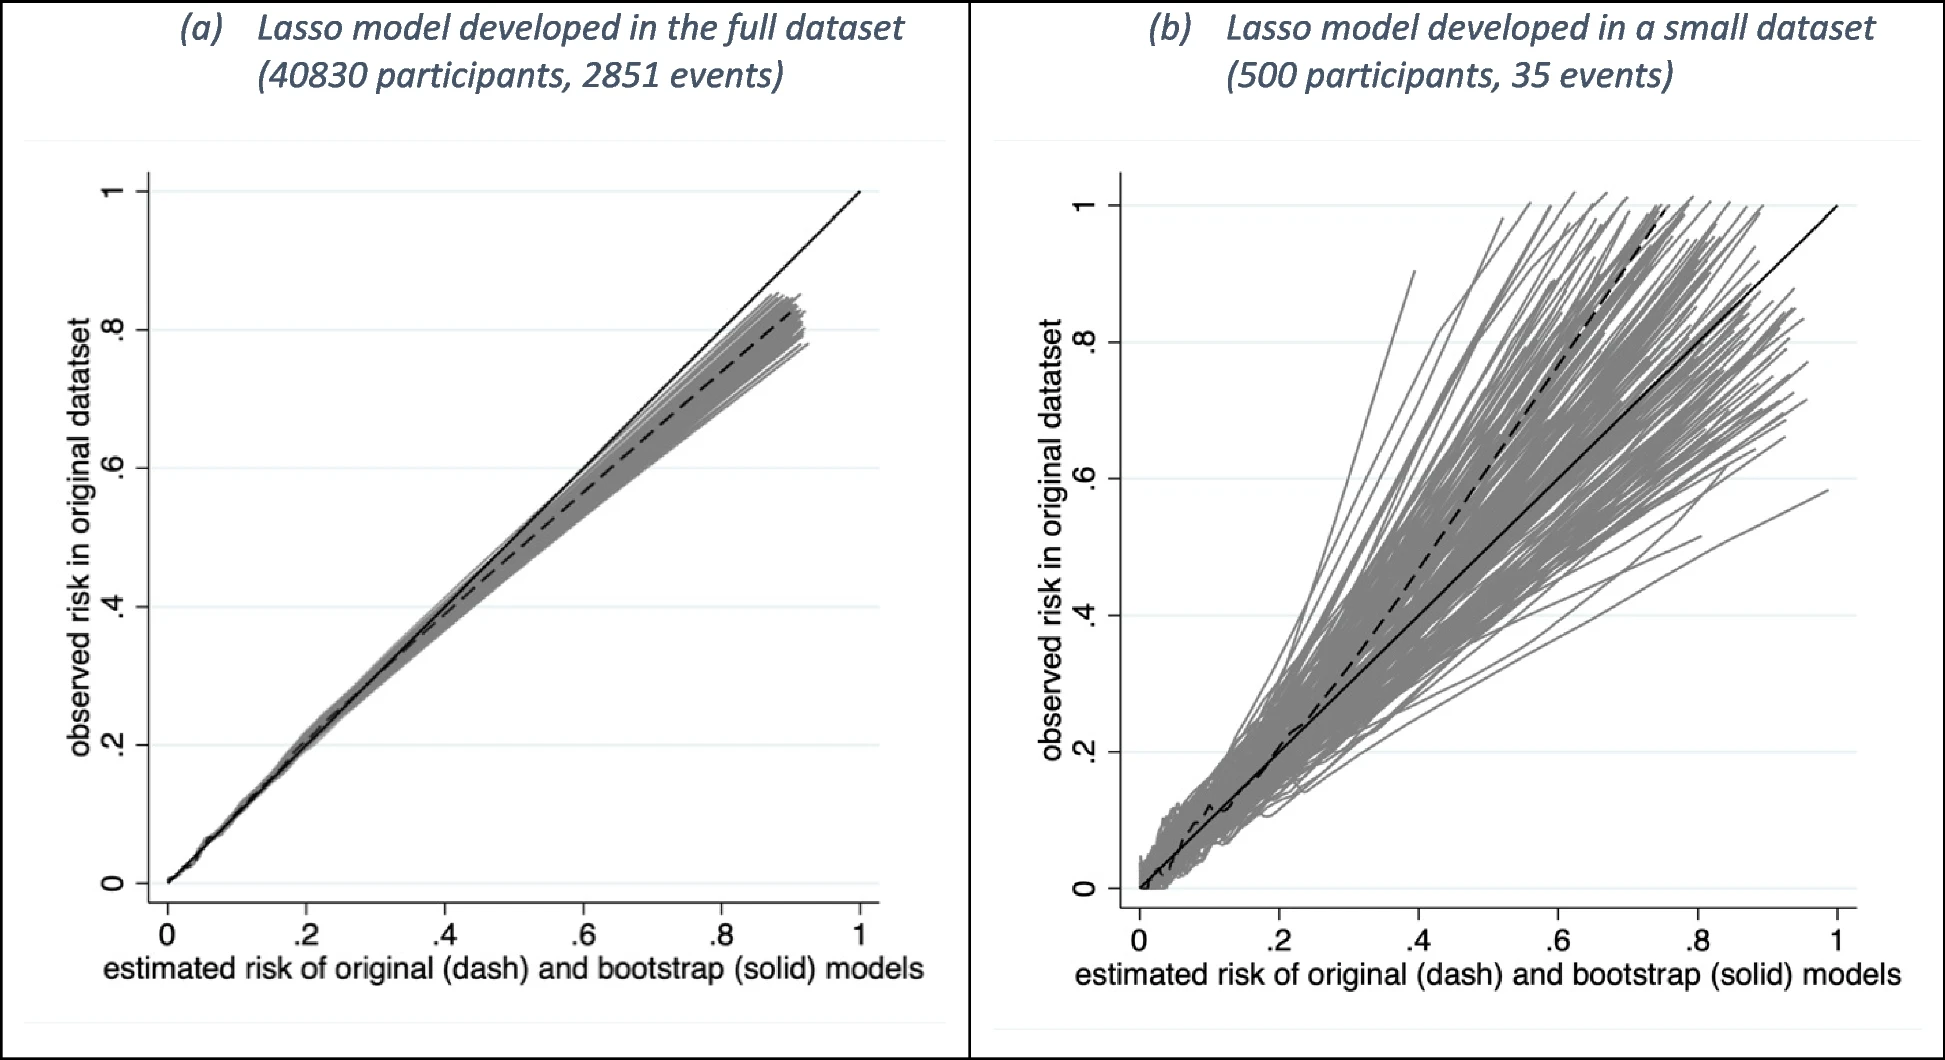
2.5 Calibration Stability
- Figure 3 (optional main / supplement): Calibration instability spaghetti plot
- Text: do curves vary widely? If yes, calibration is not stable.
Recommended Figure Placement (Simple Rule)
Main manuscript (minimum strong set)
Prediction instability plot (must have if your paper emphasizes reliability)

ⓒ Original publisher. Displayed via hotlinking for educational fair use; fallback image used if the primary source becomes unavailable.
Supplement (common but acceptable)
- Classification instability plot (if you use thresholds clinically)

ⓒ Original publisher. Displayed via hotlinking for educational fair use; fallback image used if the primary source becomes unavailable.
- Calibration instability spaghetti plot
ⓒ Original publisher. Displayed via hotlinking for educational fair use; fallback image used if the primary source becomes unavailable.
- Coefficient distribution plots
Discussion: How to Interpret and What to Do If It’s Unstable
If instability is high:
- It often reflects insufficient sample size, high model complexity, or unstable selection/tuning steps.
- Practical actions:
- Increase development sample size
- Simplify predictors / restrict degrees of freedom
- Stabilize tuning (e.g., repeated CV rather than single CV if relevant)
- Prefer methods that reduce variability only if they truly improve stability (penalization is not a guarantee)
Methods Summary
“We performed internal validation using bootstrapping for two purposes: (i) optimism correction to quantify overfitting in apparent performance, and (ii) a stability bootstrap to examine model instability across a multiverse of plausible development samples. For stability assessment, we generated B ≥ 200 bootstrap samples of size n with replacement. In each bootstrap sample, we redeveloped the model using the identical development strategy as the original model (same candidate predictors, same functional form strategy such as MFP/linear terms, and same selection/tuning procedure), and applied each bootstrap-developed model to the original dataset to obtain patient-level predicted risks. We quantified individual-level prediction instability using mean absolute prediction error (MAPE) and visualised instability using a prediction instability plot; we additionally assessed decision instability (classification instability) at clinically relevant thresholds and calibration instability by overlaying bootstrap calibration curves.”
Key takeaways
- Optimism bootstrap answers “Is performance inflated?”
- Stability bootstrap answers “Is the model (and each patient’s risk) reliable?”
- In stability bootstrap, redeveloping the model identically is essential.
- Patient-level prediction instability is the most clinically meaningful output.