Scikit-Learn Algorithm Cheat Sheet — Clinical Epidemiology Edition: Choosing the Right ML Type
Clinical Epidemiology ResearchUniqcret doctor knowledgesData Analytics or StatisticsMethodology and Research DesignData-Sci & Digital Health
On this page
ⓒ Original publisher. Displayed via hotlinking for educational fair use; fallback to archived copy if unavailable.
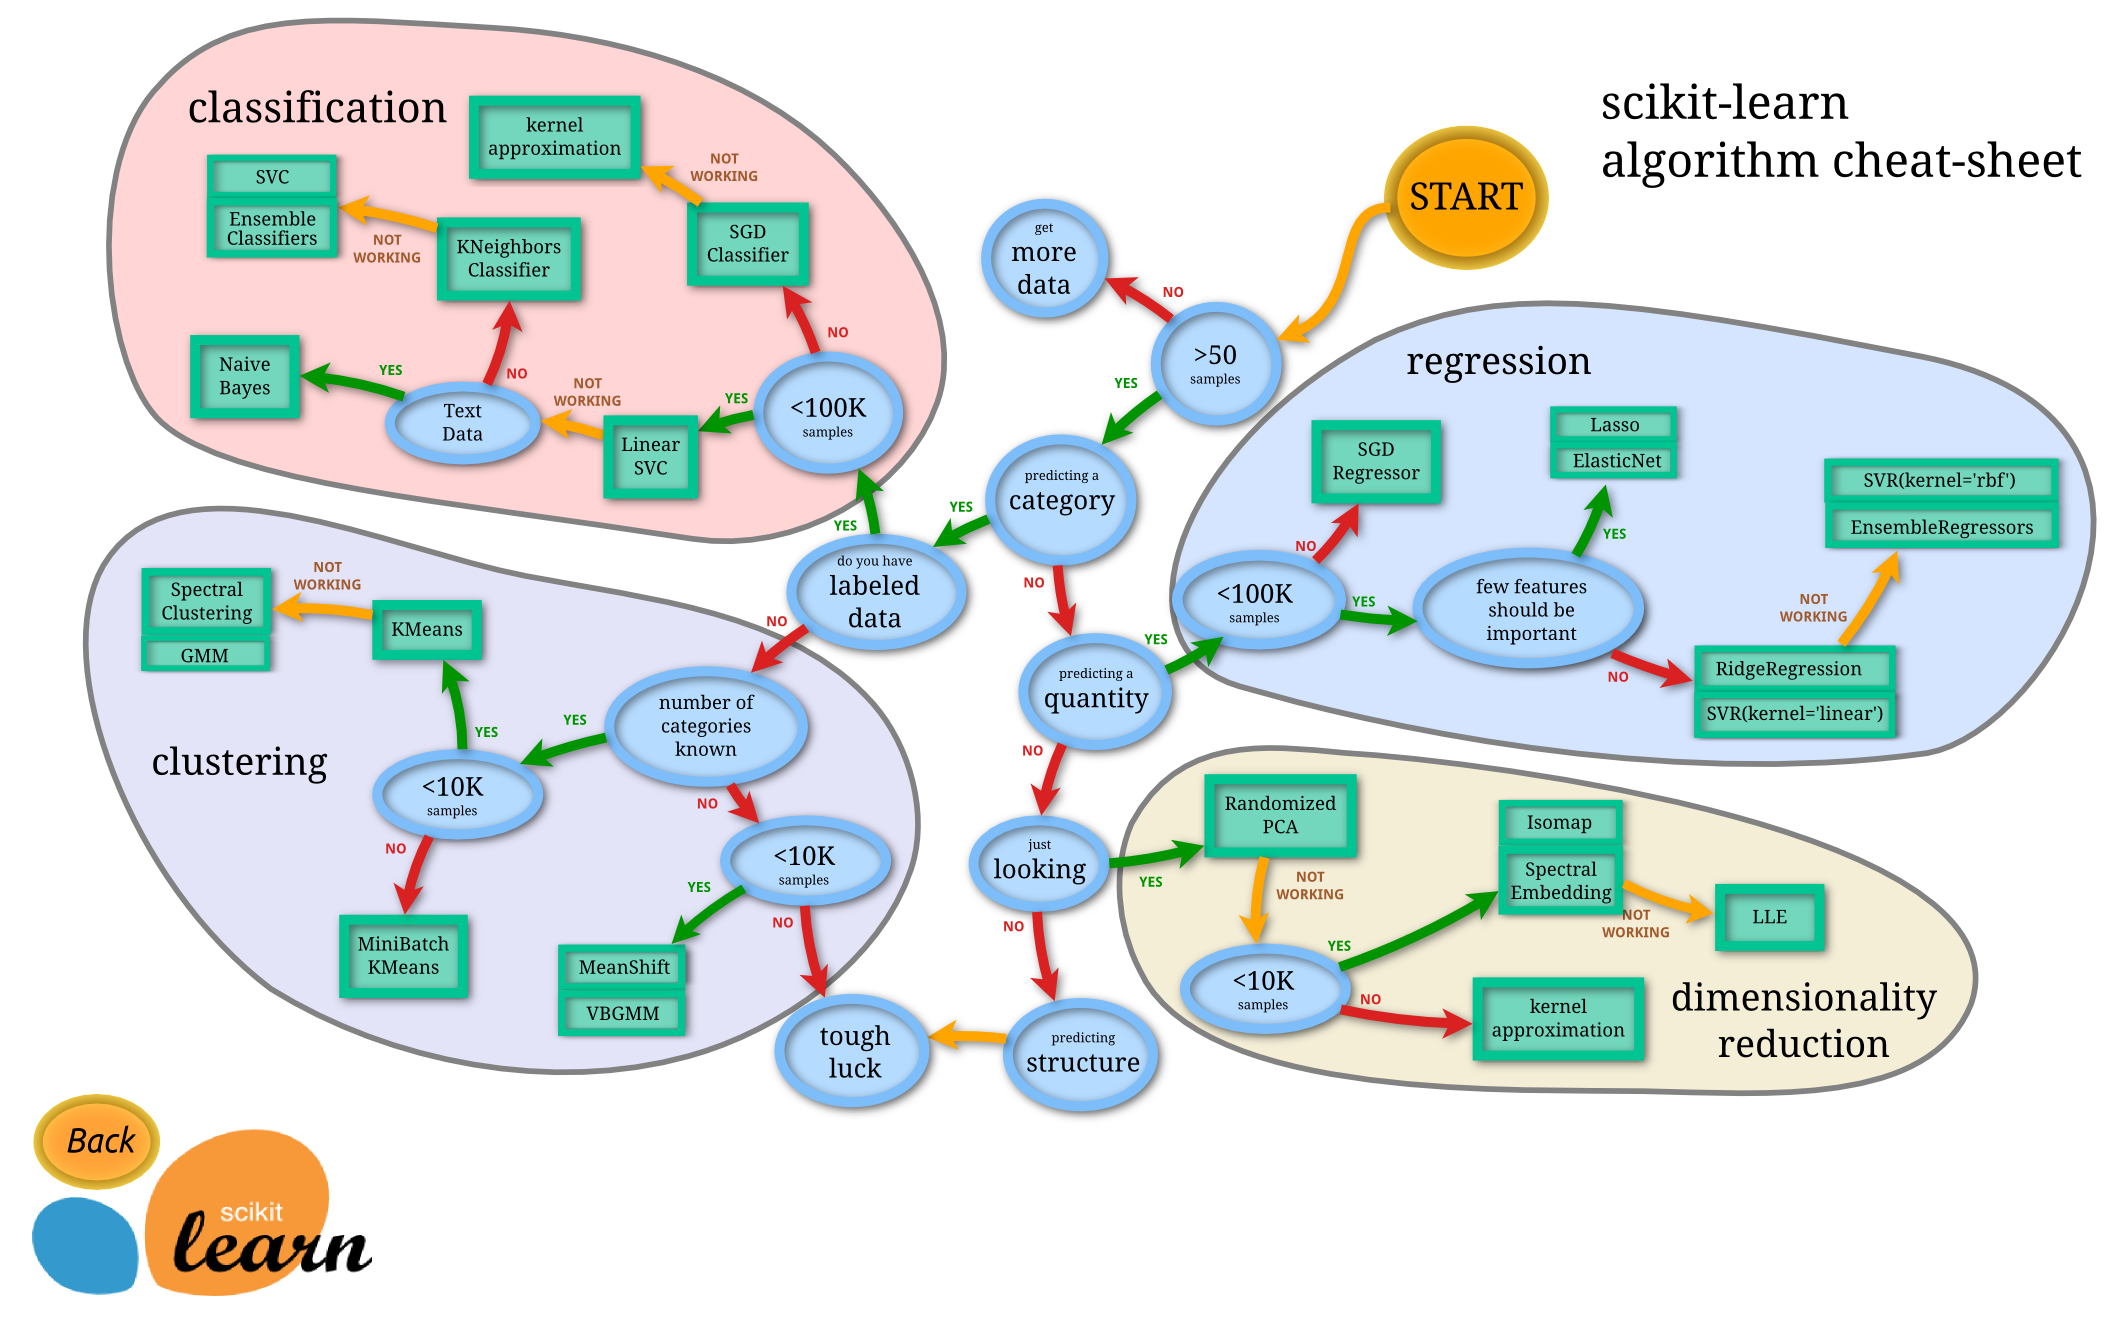
🟡 START
You begin by asking:
What kind of problem am I trying to solve in my study?
Common scenarios in clinical epidemiology:
- Identifying patients with a disease → diagnosis
- Predicting future outcomes → prognosis
- Estimating biomarkers or lab values → continuous prediction
- Finding hidden patient subgroups → phenotyping
- Simplifying many variables into a few patterns → data reduction
🔹 1. Do you have labeled data?
- YES → Go to Supervised Learning (you know the outcome)
- e.g., “We know who died / survived, who has diabetes / doesn’t.”
- NO → Go to Unsupervised Learning
- e.g., “We don’t have labels, just want to find patient subgroups.”
🟩 2. Supervised Learning
If you have labeled data, your goal is to predict an outcome.
What are you predicting?
- A category (classification) → e.g., disease status, ICU admission (Yes/No)
- A quantity (regression) → e.g., blood pressure, hospital stay length, cost
🟥 3. Classification (Predicting a Category)
Goal: Predict discrete outcomes — e.g., disease / no disease, high-risk / low-risk.
a. Do you have text data (e.g., clinical notes, discharge summaries)?
- YES → Use Naive Bayes 📘 Example: Automatically detect mentions of pneumonia in hospital discharge notes.
- NO → Continue.
b. <100K samples?
- YES → Try Linear SVC 📘 Example: Predict 30-day readmission (Yes/No) in a cohort of 10,000 patients.
- NO → Try SGD Classifier 📘 Example: Predict sepsis onset from millions of EHR time-points in ICU data.
c. Are you using kernel approximation (non-linear patterns)?
- YES → Try SVC (Support Vector Classifier) 📘 Example: Detect diabetic retinopathy (yes/no) from imaging data with non-linear relationships.
- NO → Try KNeighbors Classifier or Ensemble Classifiers (Random Forest, Gradient Boosting) 📘 Example: Predict who will develop heart failure after myocardial infarction using demographics + labs.
🟦 4. Regression (Predicting a Quantity)
Goal: Predict a continuous variable — e.g., lab value, survival time, hospital stay.
a. More than 50 samples?
- NO → Get more data. 📘 Example: You can’t predict HbA1c change from 10 patients; you need more cases.
- YES → Continue.
b. <100K samples?
- YES → Continue. Most clinical studies fit here.
- NO → Try SGD Regressor 📘 Example: Predict total hospital charges using millions of EHR records.
c. Should few features be important?
- YES → Try Lasso or ElasticNet 📘 Example: Identify key lab markers predicting survival time after cancer treatment.(Lasso can shrink unimportant predictors to zero → easier interpretation.)
- NO → Try Ridge Regression or SVR(kernel='linear') 📘 Example: Predict systolic BP from many moderately correlated features.
- If non-linear patterns present: Try SVR(kernel='rbf') or Ensemble Regressors 📘 Example: Predict ICU length-of-stay from complex physiological data.
🟪 5. Unsupervised Learning
If you don’t have labeled outcomes, you’re exploring hidden structures or relationships.
Are you just exploring patterns?
- YES → Dimensionality Reduction 📘 Example: Visualize patient clusters based on 200 lab markers in 2D.
- NO → Clustering 📘 Example: Identify unknown disease phenotypes among patients with chronic kidney disease.
🟨 6. Dimensionality Reduction
Goal: Simplify large feature sets into fewer meaningful components.
a. <10K samples?
- YES → Try Randomized PCA 📘 Example: Summarize 100 lab variables into 3 principal components explaining most variance.
- NO → Continue.
b. Using kernel approximation (non-linear data)?
- YES → Try Isomap or Spectral Embedding 📘 Example: Explore nonlinear patterns among genetic expression data.
- NO → Try LLE (Locally Linear Embedding) 📘 Example: Reduce multi-omics data to visualize patient progression patterns.
🟫 7. Clustering
Goal: Group similar patients (unsupervised).
a. <10K samples?
- YES → Continue. 📘 Example: 5,000 heart failure patients — group by comorbidity profiles.
- NO → Try MiniBatch KMeans 📘 Example: Cluster 1 million insurance records by utilization patterns.
b. Number of categories known?
- YES → Try K-Means 📘 Example: Group patients into 3 severity levels (mild/moderate/severe).
- NO → Continue.
c. <10K samples?
- YES → Try MeanShift or VBGMM (Variational Gaussian Mixture) 📘 Example: Identify latent phenotypes in sepsis using vitals and labs (without predefining the number of clusters).
- NO → Tough luck 😅 (Try sampling smaller subsets or feature reduction first.)
🔁 Summary by Problem Type (Clinical Examples)
| Problem Type | Algorithm | Clinical Epidemiology Example |
| Classification | Naive Bayes, Linear SVC, KNeighbors, SGD, SVC, Ensemble | Predict diabetes diagnosis, detect pneumonia in radiology notes |
| Regression | Lasso, ElasticNet, Ridge, SVR, Ensemble | Predict HbA1c, BP, or survival time |
| Clustering | KMeans, MeanShift, VBGMM | Find phenotypes of chronic kidney disease or sepsis subtypes |
| Dim. Reduction | PCA, Isomap, LLE, Spectral Embedding | Summarize 100 biomarkers into 2 latent factors |
| Text Data (special) | Naive Bayes, SVM | Detect adverse drug events in clinical notes |
Practical Clinical Examples — Choosing the Right ML Type
| Clinical Question | ML Type | Example Algorithm(s) | Why / Notes |
|---|---|---|---|
| 🩺 “Can we predict which hypertensive patients will develop stroke?” | Classification | RandomForestClassifier, LogisticRegression, SupportVectorClassifier (SVC) | Outcome is categorical (Yes/No). Models predict probability of stroke occurrence. |
| 🏥 “Which factors best predict hospital stay length?” | Regression | RandomForestRegressor, Lasso, ElasticNet, RidgeRegression | Outcome is continuous (days). Regularized regressions highlight key predictors; Random Forest can handle non-linear relationships. |
| 💨 “Can we find subgroups of COPD patients with similar symptoms?” | Clustering (Unsupervised) | KMeans, GaussianMixtureModel (GMM), MeanShift, VBGMM | No labels — the goal is to discover hidden phenotypes or patient subgroups. |
| 🧬 “Can we reduce 300 lab markers into a few composite risk factors?” | Dimensionality Reduction | PCA, Isomap, t-SNE, LLE, SpectralEmbedding | Reduce many correlated biomarkers to fewer components for visualization or downstream analysis. |
| 📝 “Can we automatically identify mentions of adverse drug events in notes?” | Text Classification (NLP) | NaiveBayes, LinearSVC, LogisticRegression (with TF-IDF) | Text data with labeled outcomes; algorithms classify notes mentioning adverse drug events. |
| 🧠 “Can we predict which ICU patients will deteriorate within 24 hours?” | Classification (Time-series) | GradientBoostingClassifier, XGBoost, LSTM (if temporal) | Binary outcome (deteriorate vs stable). Uses time-based features from EHR. |
| 💵 “Can we estimate total hospital cost per patient?” | Regression | RandomForestRegressor, XGBoostRegressor | Continuous numeric outcome (cost). Captures nonlinear effects of demographics and clinical variables. |
| ⚕️ “Can we group diabetic patients by treatment response patterns?” | Clustering (Phenotyping) | KMeans, Hierarchical Clustering, DBSCAN | No known labels. Unsupervised grouping to discover response phenotypes. |
| 🧩 “Can we visualize overall patient similarity based on 100 variables?” | Dimensionality Reduction (Visualization) | PCA, UMAP, t-SNE | Helps visualize complex data in 2D/3D space — e.g., to show clusters of similar patients. |
| 💊 “Does a specific drug reduce mortality in COVID-19 patients?” | Causal Inference (not pure ML) | PropensityScoreMatching, TargetedMaximumLikelihood (TMLE), Double Machine Learning | Seeks causal effect, not prediction — integrates ML for confounder adjustment. |
⚕️ How This Helps in Clinical Epidemiology
- ✅ Match your question → ML family → right algorithm
- 🔍 Keeps interpretability and clinical relevance central
- 📈 Encourages external validation (across hospitals or populations)
- 📊 Use feature importance or SHAP values for transparency
- ⚠️ Remember: Prediction ≠ Causation — causal inference requires different frameworks
0